
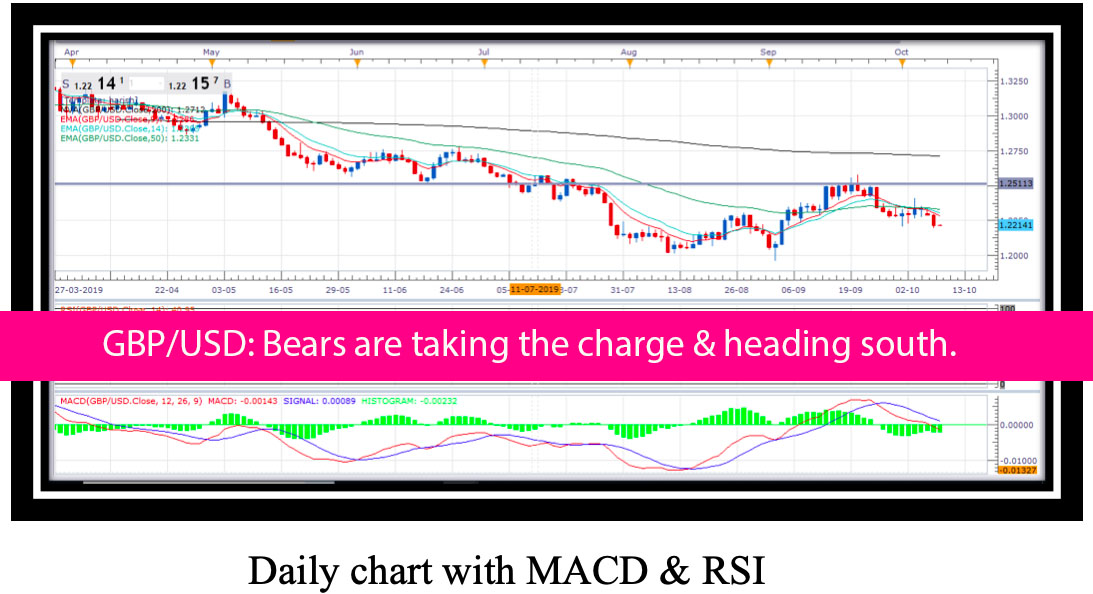
Overview:- By analyzing the daily technical chart we can see that after the tug of war bears got the charge and headed towards south side. Yesterday we have seen a
Category: Market Insights

GBP/JPY: Pair turned down from 50% Fibonacci level.GBP/JPY: Pair turned down from 50% Fibonacci level.
Overview By observing the daily technical chart we can see that earlier pair was trading and moving in a downtrend and a downtrend line was also lying on the chart

GBP/USD: Massive bullish storm from bull’s side can be seen.GBP/USD: Massive bullish storm from bull’s side can be seen.
Overview:- The GBP/USD pair retained the negative tone seen on previous updates, extending its weekly decline to 1.2302, its lowest in two weeks. By analyzing the daily chart we can see

EUR/USD: Pair is moving and trading in downtrend channelEUR/USD: Pair is moving and trading in downtrend channel
Overview:- By looking at the daily chart we can see that overall pair is trading between the downtrend channel and it is heading downside with strong bearish sentiments and it

NZD/USD: Potential double bottom pattern has been formedNZD/USD: Potential double bottom pattern has been formed
Overview:- Since last 9 consecutive week’s we are witnessing downfall in the pair and pair is heading south side with strong bearish momentum. The pair has arrived at 4 year’s

AUD/USD:Bears are dominating the bulls at heading south.AUD/USD:Bears are dominating the bulls at heading south.
Overview:– The pair has become has more convincing to sell once again as we can see that a steep downfall followed by a pull back, all this set up is

EUR/USD: Roller coaster moves at the bottom of the pair.EUR/USD: Roller coaster moves at the bottom of the pair.
Overview:- By looking at the daily chart we can see that overall pair is heading downside with strong bearish sentiments and it is moving clearly in downtrend but after

GBP/USD: Massive bullish storm from bull’s side can be seen.GBP/USD: Massive bullish storm from bull’s side can be seen.
Overview:- By analyzing the daily chart we can see that a massive bullish storm in the pair where bulls are making successively higher highs and higher lows on daily as

USD/CAD: Received supply pressure from 200 SMA zoneUSD/CAD: Received supply pressure from 200 SMA zone
Overview:– By analyzing the daily chart of the pair we can see that pair has made a rally from 1.3012 level and was limited to 1.3380 level. Overall bulls were

GBP/USD: Strong counter attack by bulls from the bottom end.GBP/USD: Strong counter attack by bulls from the bottom end.
Overview:- By analyzing the daily chart we can see that earlier pair was heading south side and it’s making successively lower lows and lower highs by getting the supply pressure