Overview:– The pair has become has more convincing to sell once again as we can see that a steep downfall followed by a pull back, all this set up is just for short the pair as we know that in the downtrend market sell on high will be profitable strategy. A massive bearish storm on the daily chart indicates that bears are leading in the game and playing at their front foot. The bears are dominating the bears at every nook and corner, and the hope for further bearish sentiments is increasing by leaps and bounds.
Fundamental Analysis:-
Market is waiting for the RBA Governor Lowe Speech which is scheduled on Tuesday and US manufacturing PMI data which is scheduled today. These two major data may impact the pair and will give the further direction to the pair. Despite recent U-turn in the US-China trade saga, the AUD/USD pair remains under pressure around two-week low as it trades near 0.6770 during the early Asian session on Monday. The USD regains traction amid recovering US bond yields and added to the pressure. Not so encouraging trade-related headlines continue to exert pressure on Friday.
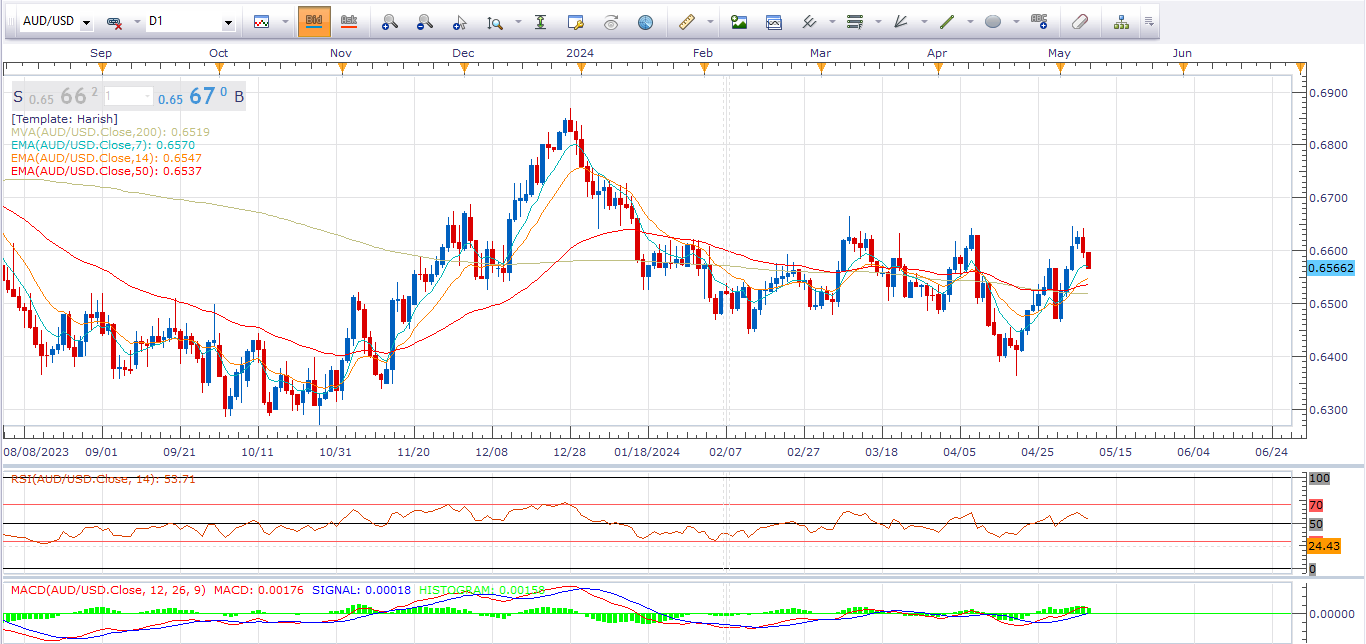
Technical Analysis:- From technical prospective we can see that pair is heading towards south side with the formation of three consecutive bearish marabuzo candlestick price pattern which is known as three black crow pattern and it’s a very strong bearish pattern. The way bears are reacting it seems like they are again leading in the game and heading to 0.6680 level which is a strong support level. An intermediate downtrend line is still valid on the daily chart which indicates that bears are falling down to retest this mentioned down side levels. Overall pair is trading below all the major and minor EMA lines.
A bearish crossover on the MACD crossover is verifying this downside move and RSI is also falling down below 50 level which is providing us bearish signal. Red dots on parabolic SAR are favoring the bears and the expansion mode of Bollinger band which is showing downside risk.
What next:- On weekly chart the last week was the fabulous week as we can see a bearish engulfing candlestick has been posted on the chart which is a very strong trend reversal candlestick and this week also bears are leading in the game well it’s just a starting further selling is still on the cards.
Odds are in favor of bears. Intraday bias remains bearish on the pair as long as pair is sustaining below the 0.6900 level. The 0.6680 level is the key support level followed by 0.6650 level where as 0.6850 level is the key resistance level followed by 0.6900.
Trade idea:- Based on chart and studies above we can suggest that sell at 0.6780-90 target is 0.6980 and 0.6700 with the tight stop loss of 0.6900.