Overview:- Since last 9 consecutive week’s we are witnessing downfall in the pair and pair is heading south side with strong bearish momentum. The pair has arrived at 4 year’s fresh low and from there we have seen panic buying from intraday prospective where bulls took the charge. A short term downtrend line was also lying on the daily which has been breached out but the intermediate downtrend line still remains intact. The pressure is coming from bulls to take it around 0.6400 level.
Fundamental analysis:- The US Treasury Secretary Steve Mnuchin conveyed the message of Chinese Vice Premier’s US visit in the next week. Mr. Mnuchin also said that the Chinese delegation’s delayed visit to the US farm was due to the request from the US-side.
Adding to the trade optimism was the US President Donald Trump’s statement that China has committed to buy a lot of agricultural goods from the US.With this, the Kiwi pair extended its earlier recovery from multi-year lows. Though, a lack of major drivers and an early Asian session limits the pair’s performance by the press time.
Technical Analysis: – From technical prospective we can see that pair took the charge from yesterday itself where bulls made a fabulous counter attack from 4 year’s low and took the pair from 0.6257 to 0.6298 level. Well it is just a starting further picture is still due and we are expecting that a rally is awaited.
On 4 hourly chart it has cleared all the minor EMA lines and even RSI along with MACD indicator is also favoring the bulls with positive territory and bullish crossover.
Recently it has given us valid breakout of downtrend line on the 4 hourly chart which is providing us bullish signal and the way bulls are reacting it seems like if it trades and settles above 0.6320 level then it may open the way towards the 0.6380 and 0.6420 level.
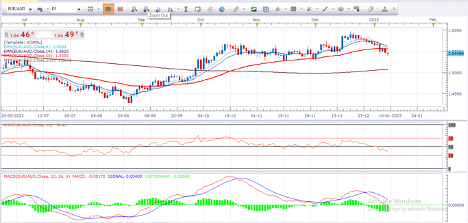
The further upside risk is still on the cards and our bias remains bullish on the pair as long as 0.6250 levels remains intact. The green dots of parabolic SAR on the downside of the candles are suggesting us to keep our view as bullish whereas RSI is also trying to come up above 50 level and MACD line recently crossed up the signal line on the daily chart Overall pair is trading and sustaining below the moving average lines which is generating bearish signal for the time being.
What Next:- Overall bulls are playing at their front foot and leading in the game and the way bulls are reacting it seems like they are not ready to stop in early stage and they are approaching the further upside .The 0.6400 level is immediate key resistance level followed by 0.6500 level where as 0.6200 level can be considered as key support level followed by 0.6130 level. Odds are in favor of bulls and intraday to weekly bias remains bullish on the pair.
In our previous report also we mentioned to short the pair at 0.6600 level for the target of 0.6350 level and 0.6250 level and our target has been achieved so we hope that our readers must have made profit from this move.
Trade idea:- Based on chart and studies above we would suggest our traders and investors that go for buy around 0.6280-70 level for the target of 0.6350 and 0.6400 with stop loss of 0.6210 level.