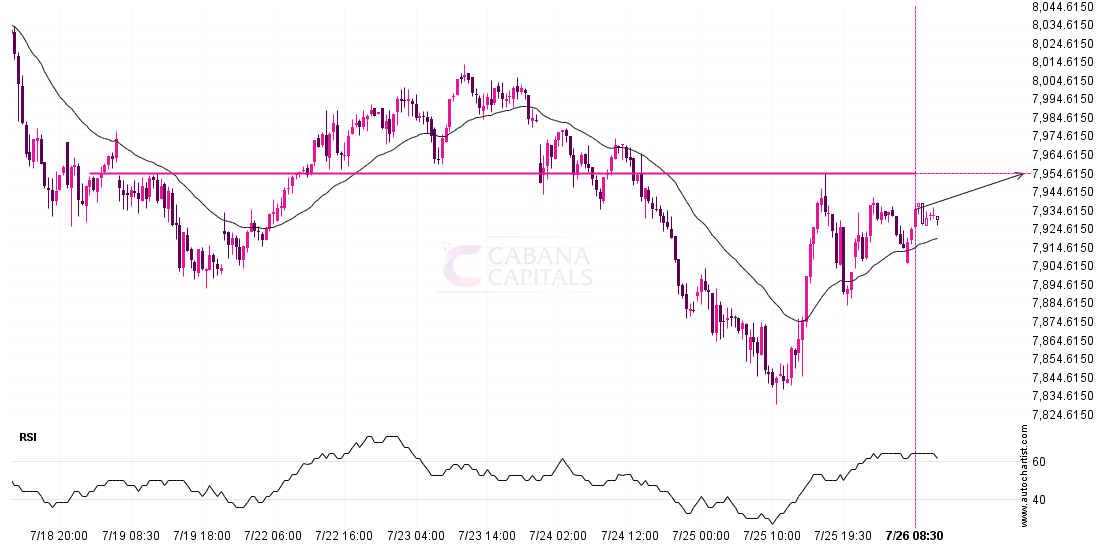
ASX 225 is on the approachASX 225 is on the approach
ASX 225 is moving towards a line of 7954.3999 which it has tested numerous times in the past. We have seen it retrace from this position in the past, so

ASX 225 is moving towards a line of 7954.3999 which it has tested numerous times in the past. We have seen it retrace from this position in the past, so
You would be well advised to confirm the breakout that has just occurred – do you believe the move through resistance to be significant? Do you have confirming indicators that
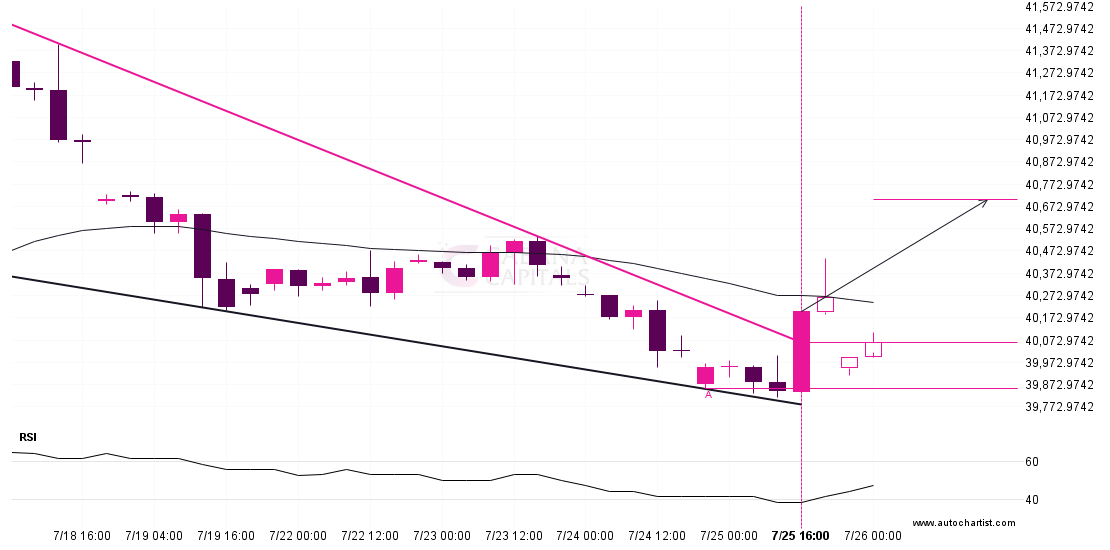
BTCUSD is moving towards a resistance line. Because we have seen it retrace from this level in the past, we could see either a break through this line, or a

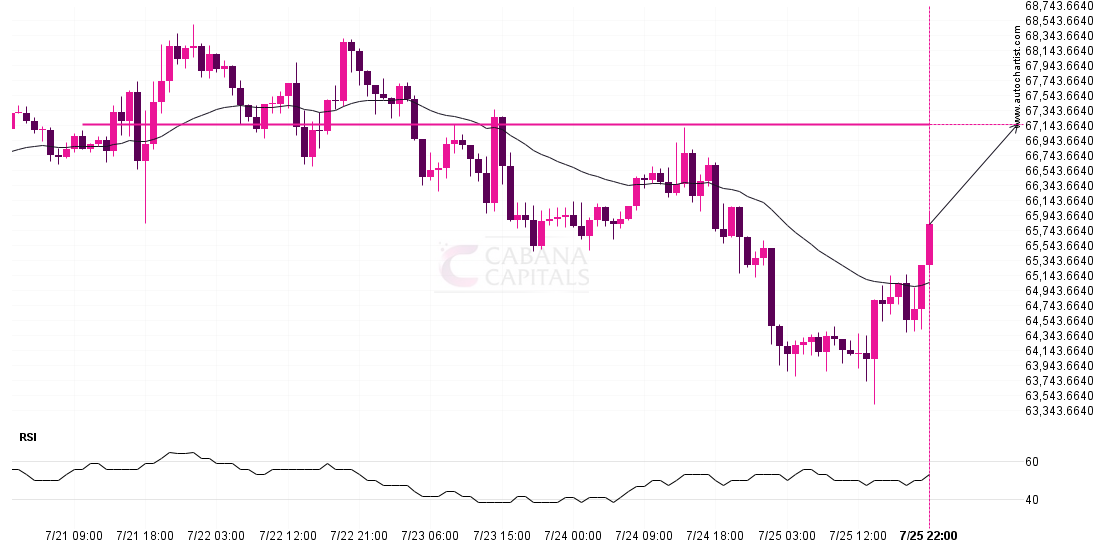
Overview:–By looking at the daily chart we can see that buyers are showing their potential in the market. The market is showing upside momentum in the market. From the technical
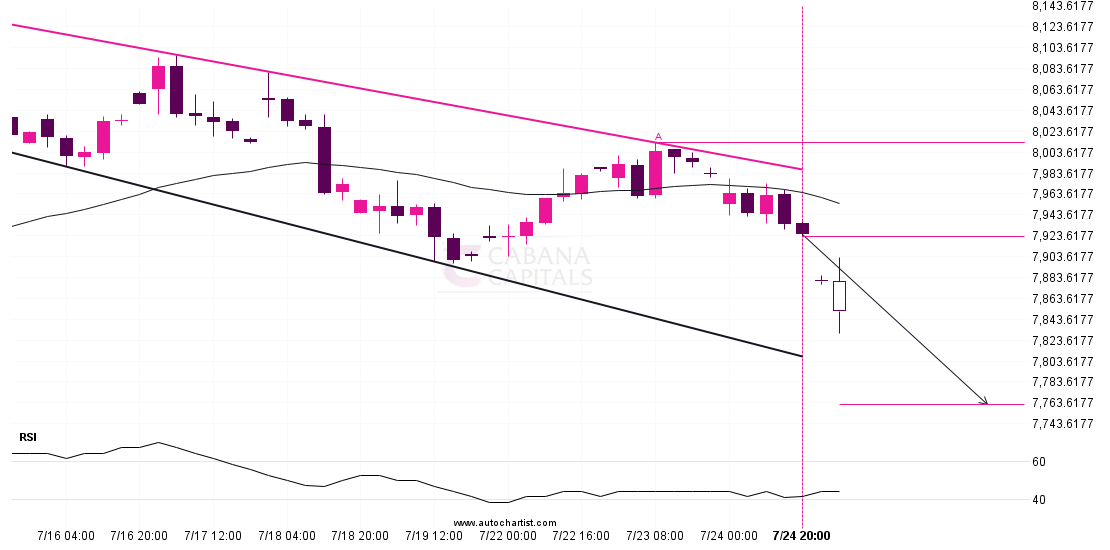
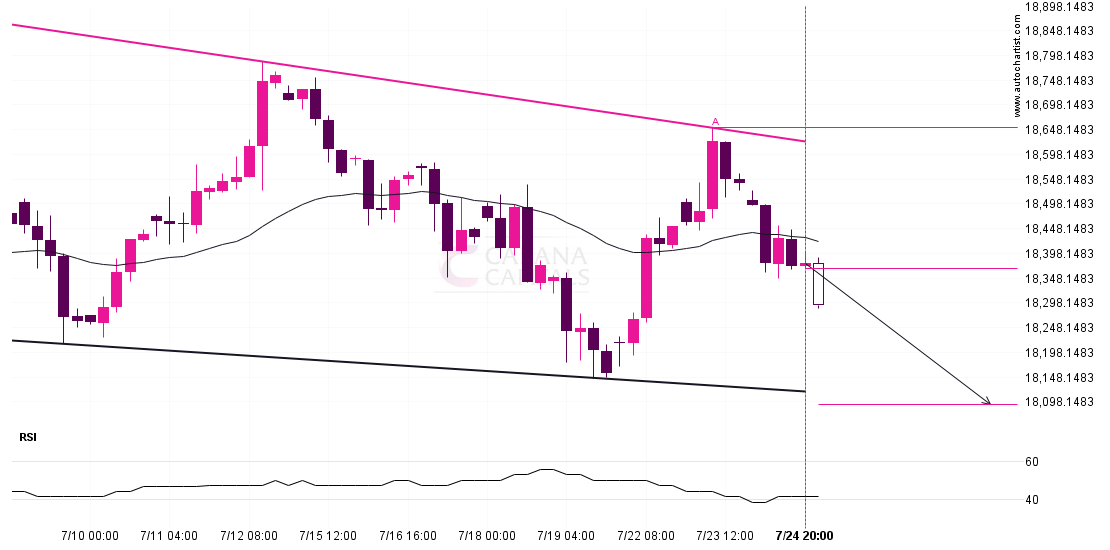
ASX 225 is trapped in a Channel Down formation, implying that a breakout is Imminent. This is a great trade-setup for both trend and swing traders. It is now approaching
The movement of DAX 40 towards the support line of a Channel Down is yet another test of the line it reached numerous times in the past. This line test
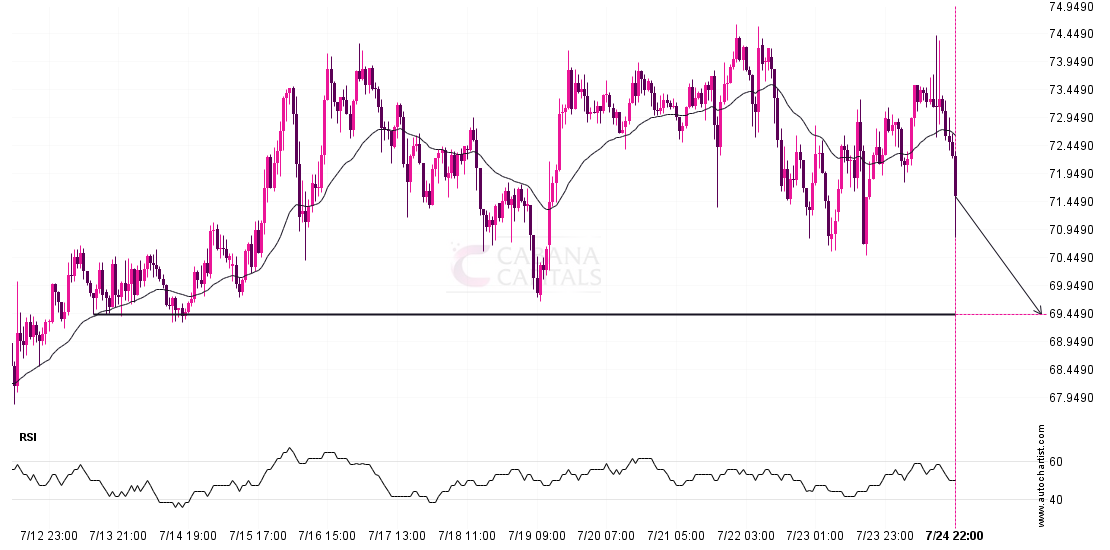
LTCUSD is heading towards 69.4400 and could reach this point within the next 3 days. It has tested this line numerous times in the past, and this time could be

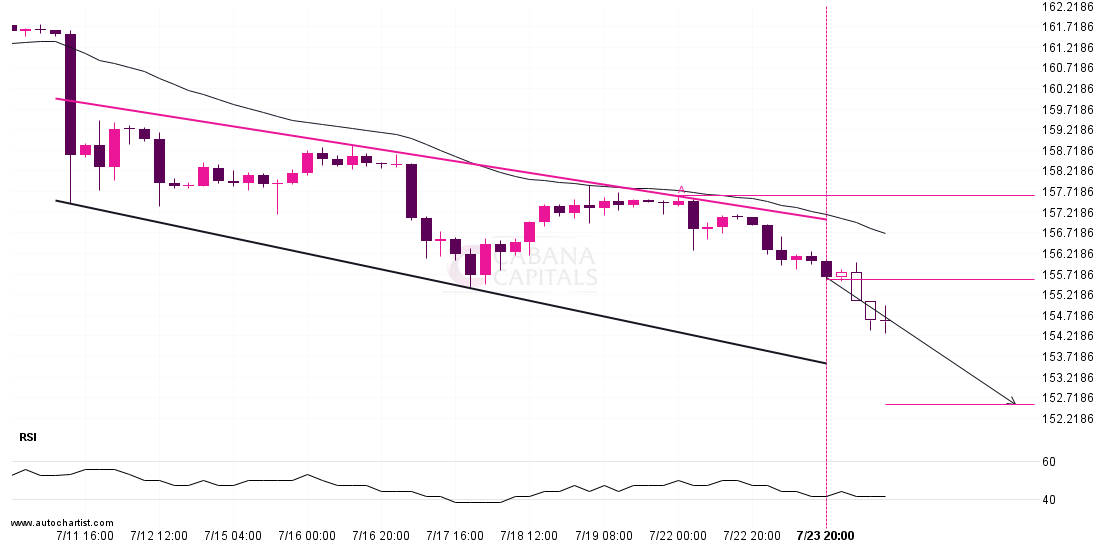
Overview:- By analyzing at the daily chart we can see that pair is making successively lower lows and lower highs where only bears are showing their full strength and
The movement of USDJPY towards the support line of a Channel Down is yet another test of the line it reached numerous times in the past. This line test could

GBPUSD has broken through 1.2899 which it has tested numerous times in the past. We have seen it retrace from this price in the past. If this new trend persists,