A potential bullish movement on USDCADA potential bullish movement on USDCAD
USDCAD is moving towards a resistance line. Because we have seen it retrace from this line before, we could see either a break through this line, or a rebound back
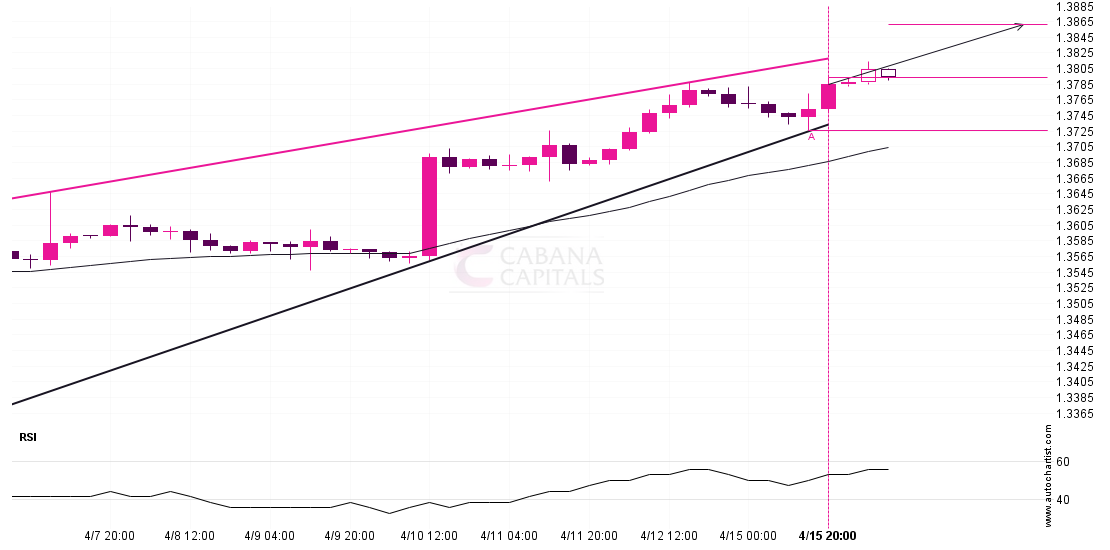
USDCAD is moving towards a resistance line. Because we have seen it retrace from this line before, we could see either a break through this line, or a rebound back
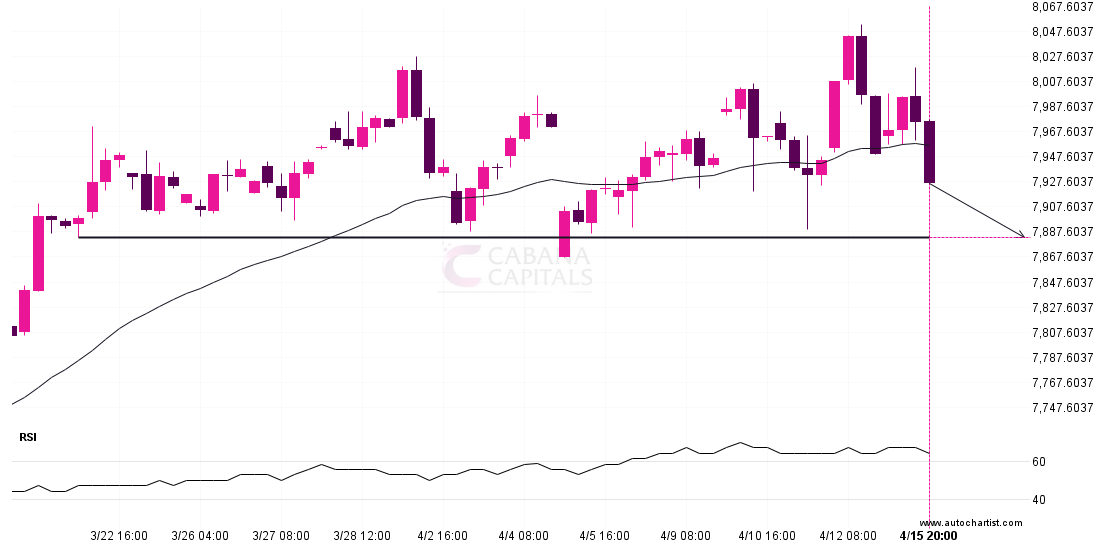
FTSE 100 is moving towards a line of 7882.7998 which it has tested numerous times in the past. We have seen it retrace from this position in the past, so

USDCHF is heading towards the resistance line of a Channel Up. If this movement continues, the price of USDCHF could test 0.9155 within the next 6 hours. It has tested
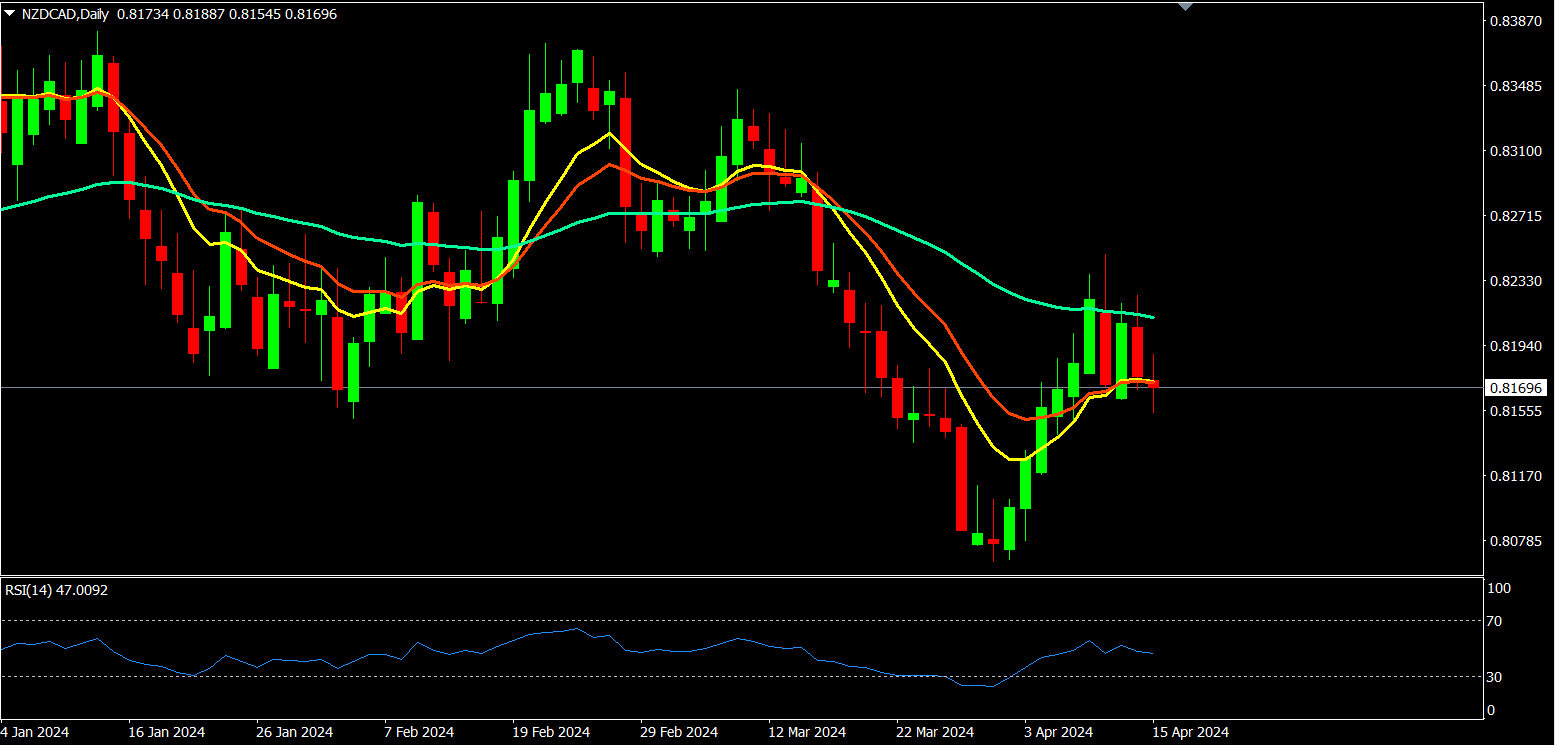
Overview:- By analyzing at the daily chart we can see that pair is making successively lower lows and lower highs where only bears are showing their full strength and they
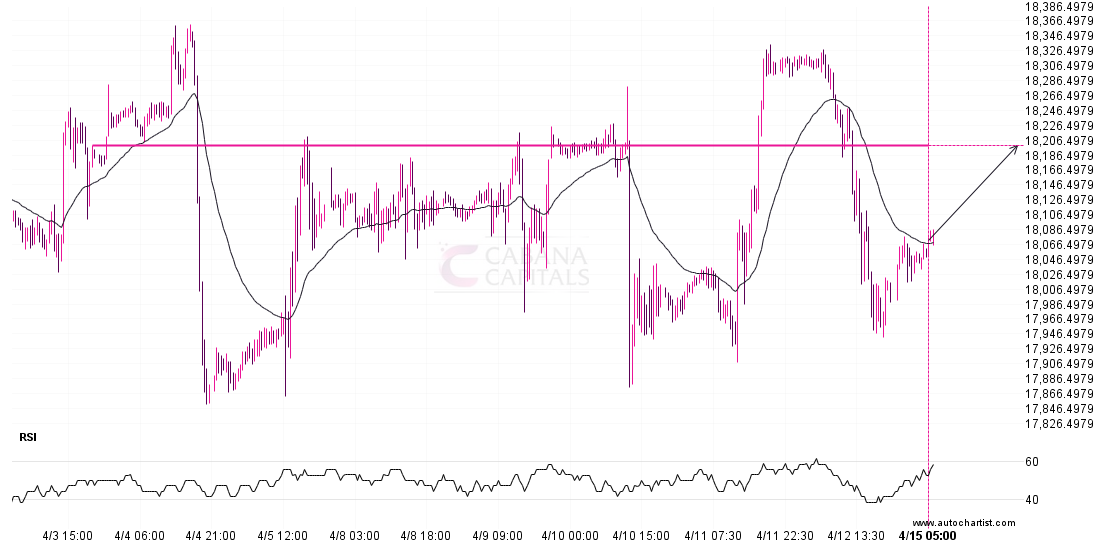
NAS 100 is moving towards a resistance line. Because we have seen it retrace from this level in the past, we could see either a break through this line, or
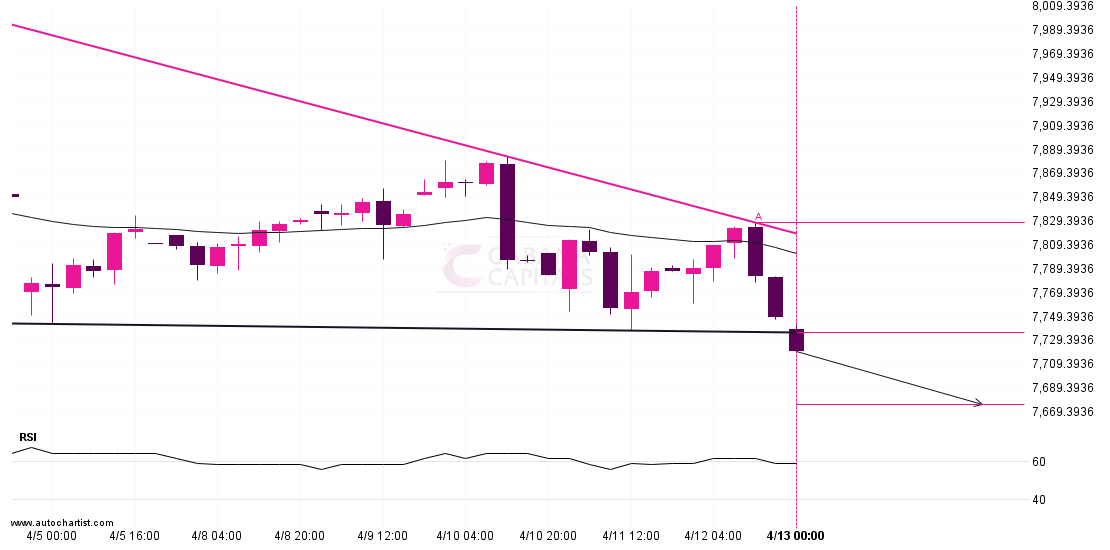
ASX 225 has broken through a support line of a Descending Triangle chart pattern. If this breakout holds true, we may see the price of ASX 225 testing 7675.6284 within
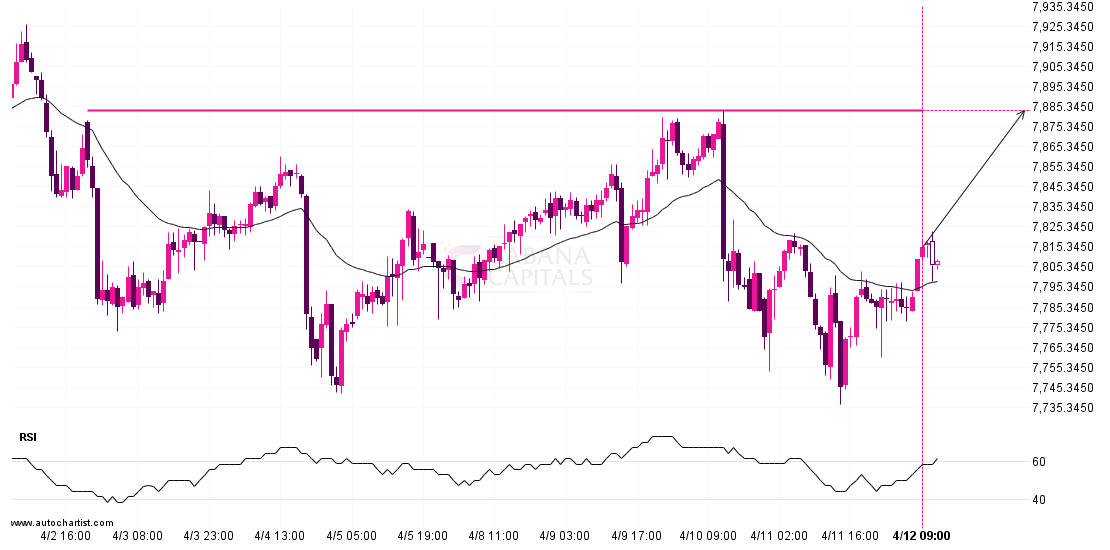
ASX 225 is about to retest a key horizontal resistance level near 7883.1001. It has tested this level 3 times in the recent past and could simply bounce off like

General overview: – By looking at the daily along with hourly chart we can see that the pair hits the lows highs in the market and bears have given us
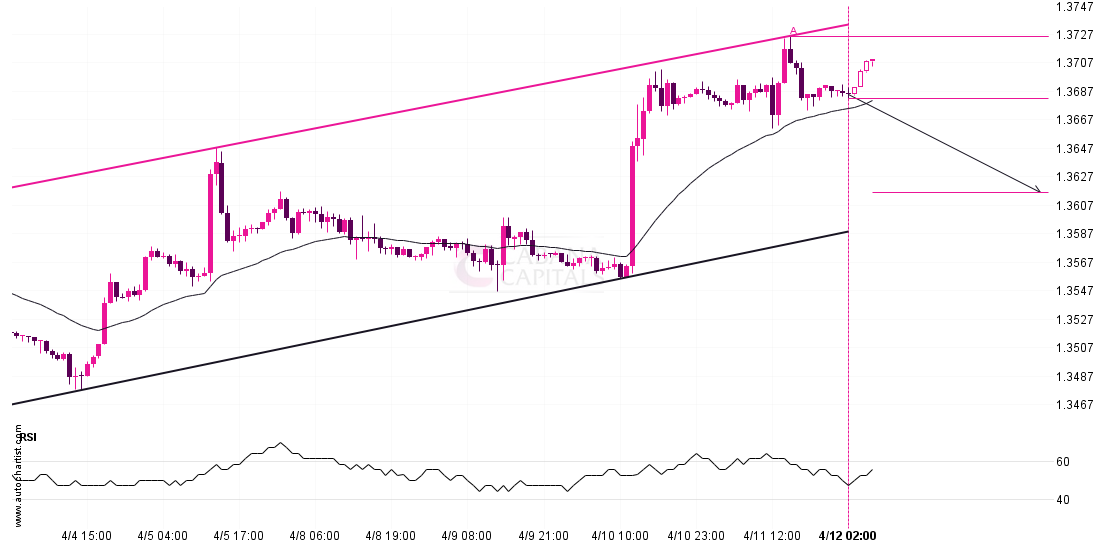
USDCAD is heading towards the support line of a Channel Up. If this movement continues, the price of USDCAD could test 1.3616 within the next 2 days. It has tested
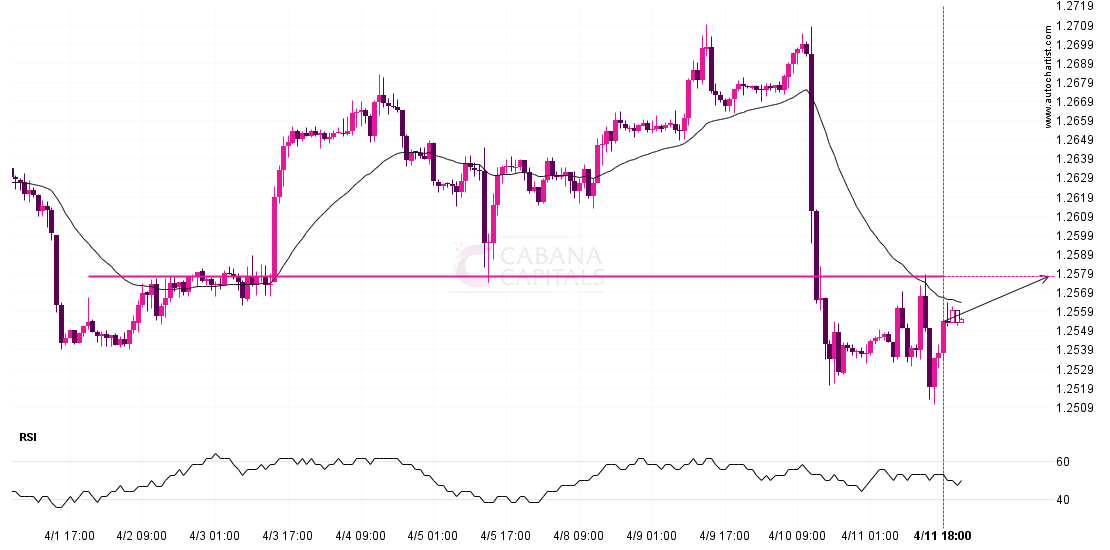
The movement of GBPUSD towards 1.2578 price line is yet another test of the line it reached numerous times in the past. We could expect this test to happen in