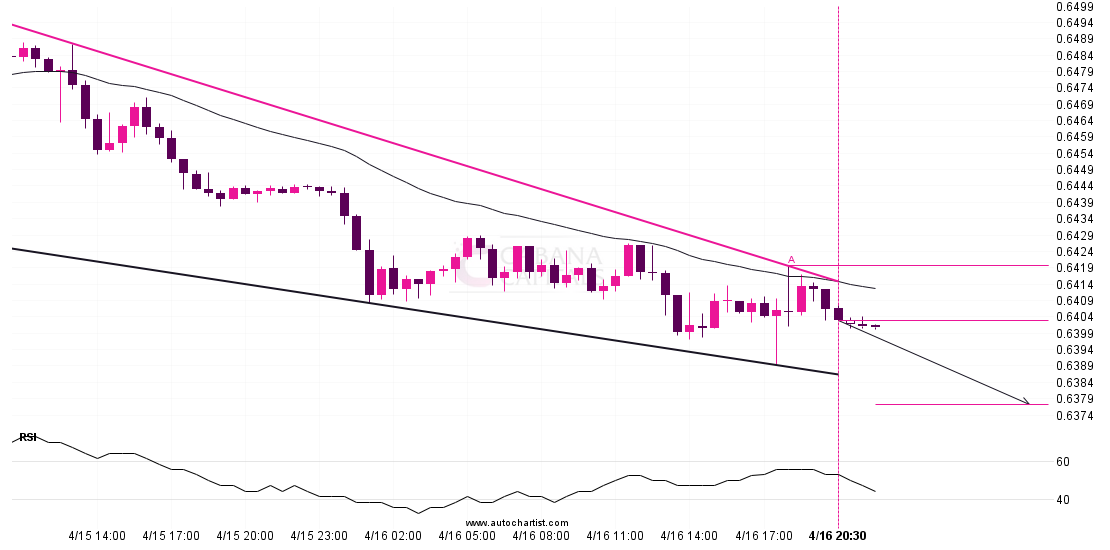
AUDUSD is moving towards a support line which it has tested numerous times in the past. We have seen it retrace from this line before, so at this stage it
Day: April 16, 2024

Confirmed breakout on FTSE 100 1 hour chartConfirmed breakout on FTSE 100 1 hour chart
FTSE 100 has broken through 7920.1001 which it has tested numerous times in the past. We have seen it retrace from this price in the past. If this new trend

EURCHF : It’s time to check the potential of bears.EURCHF : It’s time to check the potential of bears.
Overview: By looking at the daily chart we can see that sellers are showing their potential in the market. The market is showing downside momentum in the market. From the

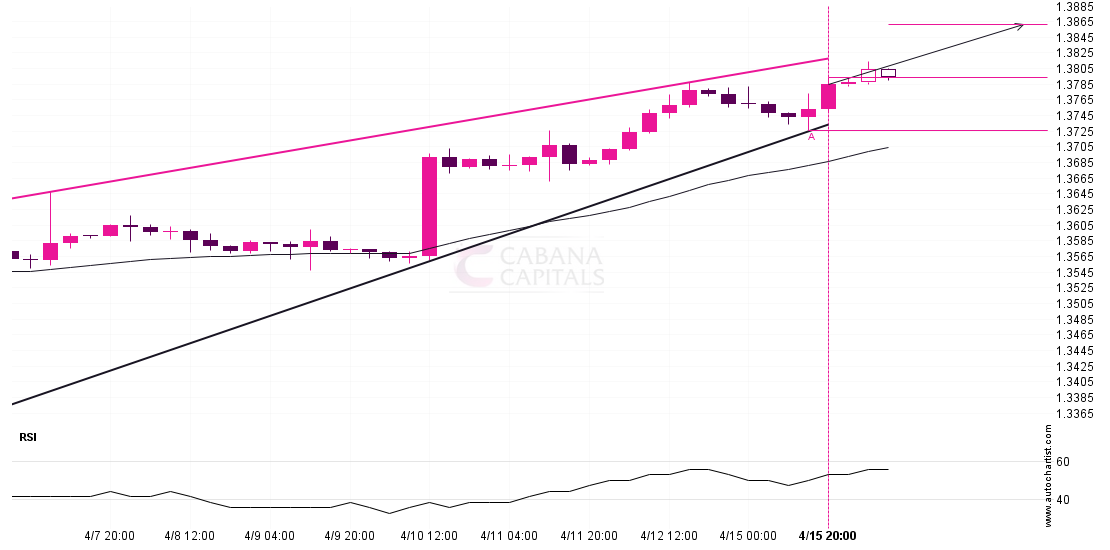
A potential bullish movement on USDCADA potential bullish movement on USDCAD
USDCAD is moving towards a resistance line. Because we have seen it retrace from this line before, we could see either a break through this line, or a rebound back

