
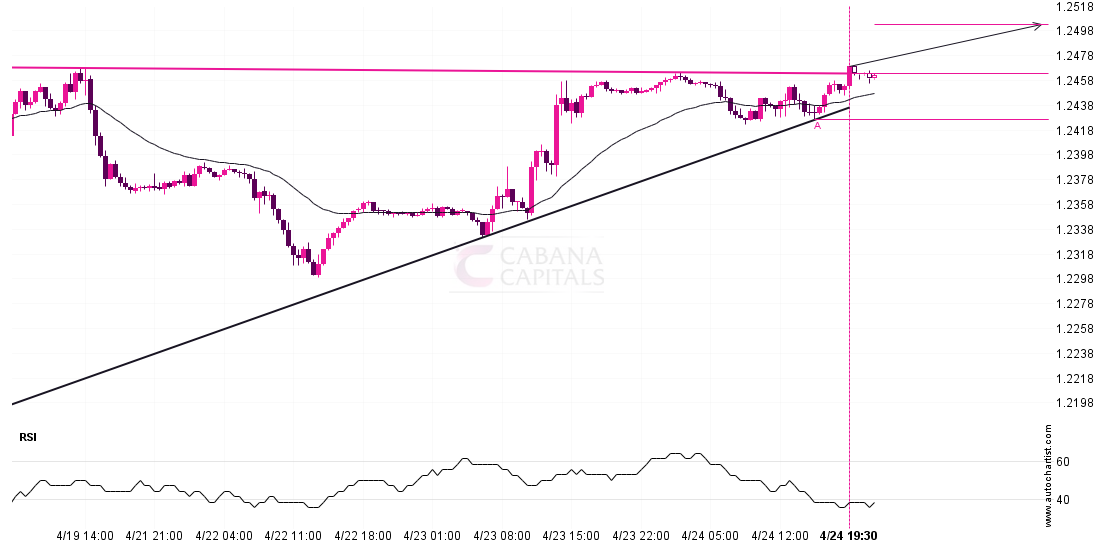
Ascending Triangle pattern identified on GBPUSD has broken through a resistance level with the price momentum continuing to move in an upward direction. A solid trading opportunity continues with the
Day: April 24, 2024
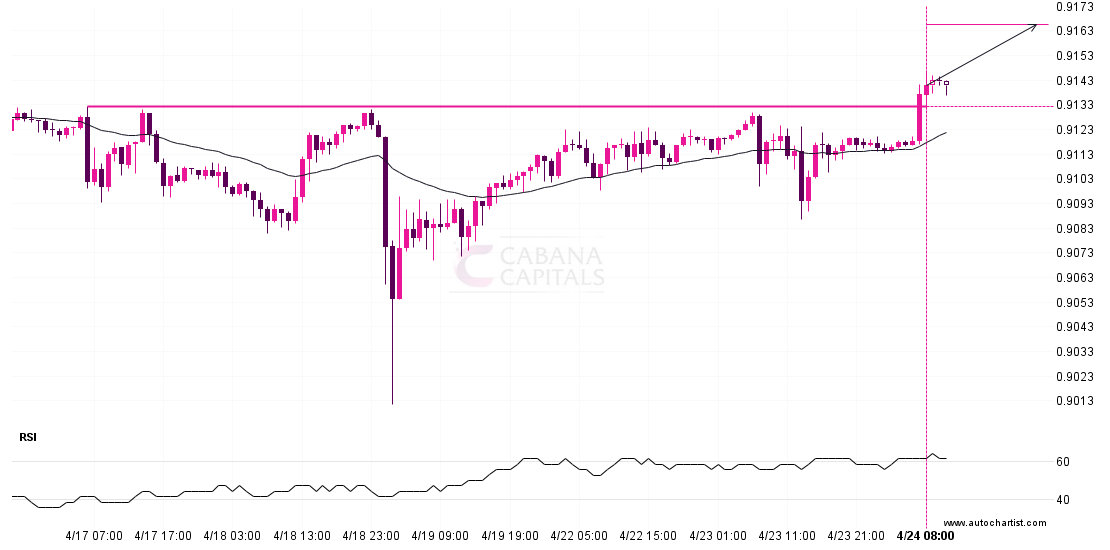
USDCHF – resistance line broken at 2024-04-24T09:00:00.000ZUSDCHF – resistance line broken at 2024-04-24T09:00:00.000Z
USDCHF has breached the resistance line at 0.9133. It may continue the bullish trend towards 0.9166, or, it may prove to be yet another test of this level. Supported by

GBP/CAD: Bulls are spring back to north side form 200 EMA line.GBP/CAD: Bulls are spring back to north side form 200 EMA line.
Overview: By looking at the daily chart we can see that buyers are showing their potential in the market. The market is showing upside momentum in the market. From the technical
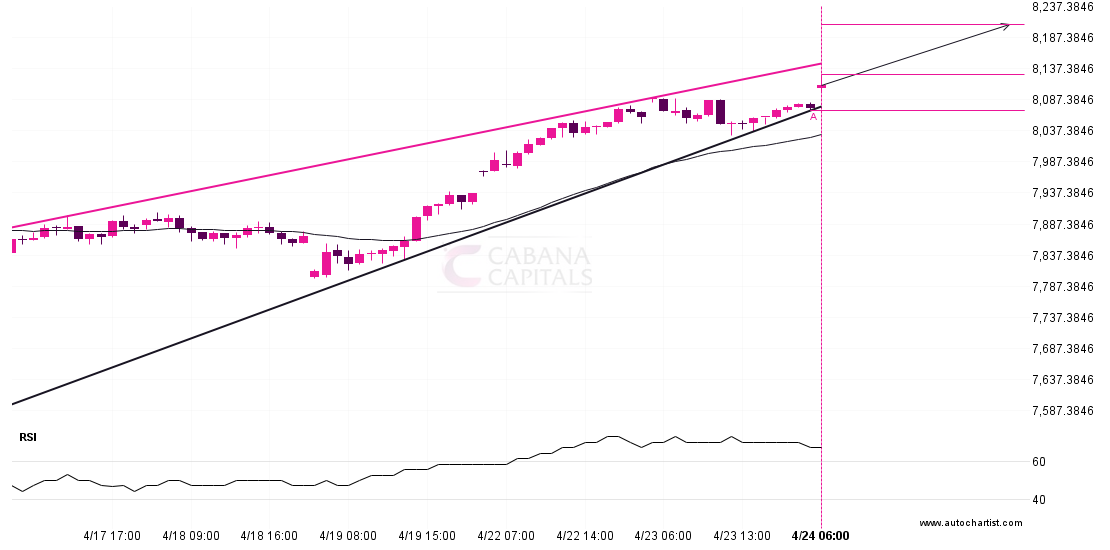
Will FTSE 100 have enough momentum to break resistance?Will FTSE 100 have enough momentum to break resistance?
Emerging Rising Wedge detected on FTSE 100 – the pattern is an emerging one and has not yet broken through support, but the price is expected to move up over