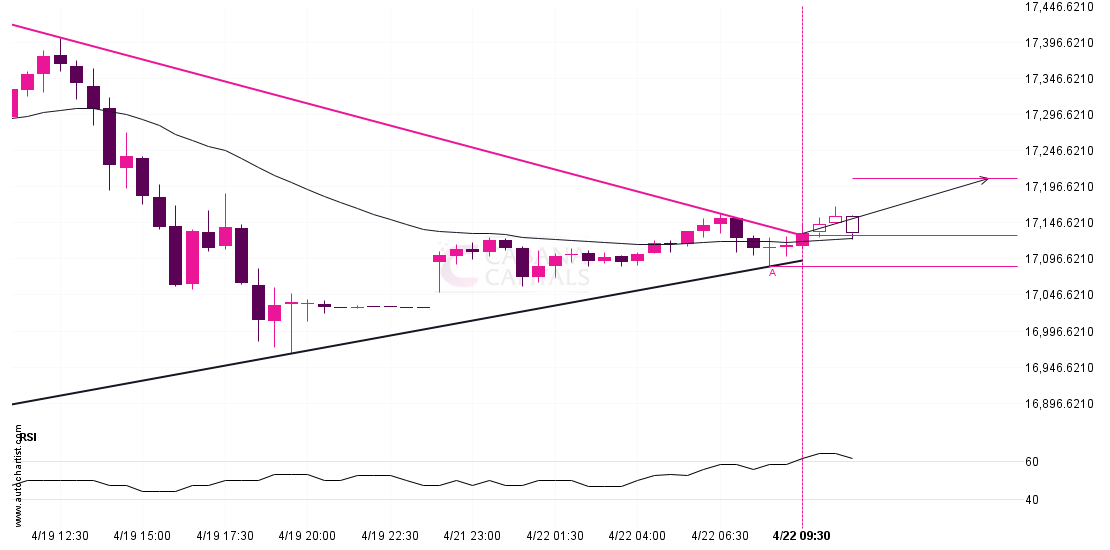
NAS 100 has broken through a resistance line of a Triangle chart pattern. If this breakout holds true, we may see the price of NAS 100 testing 17207.5862 within the next 5 hours. But don’t be so quick to trade, it has tested this line in the past, so you should confirm the breakout before taking any action.
Supported by Upward sloping Moving Average
Target: 17207.5862 Entry: 17129.1254 Stop: 17086.3732