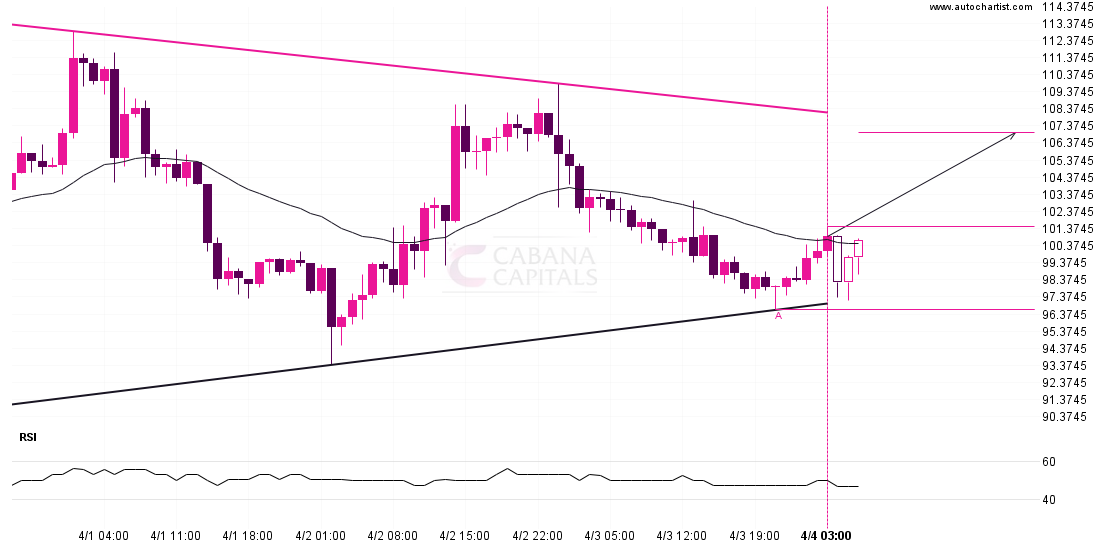
Emerging Triangle pattern in its final wave was identified on the LTCUSD 1 hour chart. After a strong bullish run, we find LTCUSD heading towards the upper triangle line with a possible resistance at 106.9973. If the resistance shows to hold, the Triangle pattern suggests a rebound back towards current levels.
Target: 106.9973 Entry: 101.49 Stop: 96.62