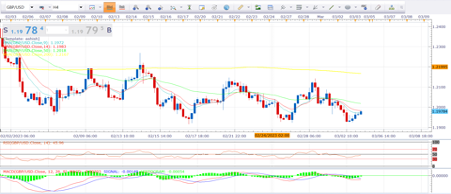
Overview: By looking at the daily chart we can see that buyers are showing their potential in the market. The market is showing upside momentum in the market. From the technical prospective, The market is previously formed three bullish candle which cause market to rise, the swings are making successively lower lows and lower highs, In the chart hourly chart bulls are showing their strong side in the market . The way bulls are reacting it seems like they are approaching the 0.6720 region. The pain will create ‘V’ shape on daily chart.
Technical analysis: From the technical point of view can say that the bullish momentum is use to be created. The pair is getting bullish impulse; The following illustrates the daily price action and a trade set up that can be monitored from a 4-hour perspective. From a 4-hour perspective, bulls may want to wait for the price to break higher and enter on a pullback from the newly formed support structure. MACD confirms that the price is in a bullish environment, but it is still below the moving average. The kind of tug and war is going between the bulls and bears, the price is neutral right now but we suggest our buyers to go for buy side in the market as market will show its positive side soon. The price is in range bound situation .so it is very tricky to see next step of the market. Let’s wait for the session movement and till then buyers can go for short term buy.
Current status: The current status of the market is 0.6682 and the support will be 0.6595 followed by 0.6485 and the resistance is 0.6800 followed by 0.6900.
Trade Idea: based on the chart and above studies we would be recommending to our traders that go for buy at 0.6685 targets is 0.6730, 0.6780 Sl is 0.6625.


