Overview:- The pair is now heading upside and bulls are leading in the game with full of dominance in the pair. The Pair is have full strength to move up with full of bullish momentum. Well it’s just a starting of bulls further buying is still on the cards.
In our previous report also we mentioned to buy the pair around . 0.6260-50 level for the target of 0.6350 and 0.6400 with stop loss of 0.6180 level. And our first target has been achieved like a cake walk. Well the further rally is on the cards.
A continuous downfall from 0.6754 level to 0.6200 level in the pair was fabulous which indicates that it was a very long drive which has been covered by bulls but now the turn is with the bulls, whether they will convert it or not ? The suspense still arise till the time 0.6300 level is unbreachable. Well if bulls will break this level then it’s sure that they are going to continue the 0.6500 level at least and they may test 0.6650 level furthermore.
Technical Analysis: – From technical prospective we can see that a double bottom pattern has been formed on the daily chart which is providing us bullish signal and bulls have taken bounce from this level which is itself a bullish signal. This week’s closing matters a lot if it trades and sustain above 0.6400 level then it will open the way towards the 0.6600 level in near term for sure.
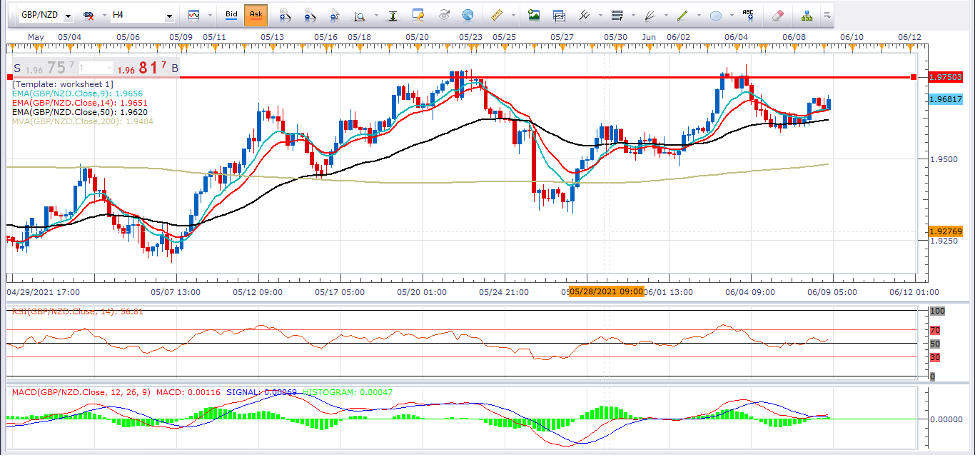
A downtrend line has been breached out which is a recent development on the chart. Will bulls sustain at this level or not ? A potential double bottom pattern has been posted on the weekly as well daily chart which is providing us bullish signal and suggesting us that it’s time to hold the pair. A short term downtrend line is still intact on the daily chart and a valid breakout of this line will open the way for the bulls or in other words the daily closing above 0.6300 level will open the way towards the 0.6600 level in near term. Overall pair is trading and sustaining between all the minor EMA line.
An upside twist in the RSI is also favoring the bulls and A bullish crossover on the MACD indicator is about to come which will be a recent development as both signal line and macd lines are coming near to each other and trying to give bullish crossover which is favoring the price action.
What Next:- The 0.6400 level is immediate key resistance level followed by 0.6500 level where as 0.6250 level can be considered as key support level followed by 0.6200 level. Odds are in favor of bulls and intraday to weekly bias remains bullish on the pair.
Trade idea:- Based on chart and studies above we would suggest our traders and investors that go for long at current levels i.e. 0.6340-30 level for the target of 0.6450 and 0.6500 with stop loss of 0.6250 level.