Overview:- Well the first view of the daily chart indicates that we are witnessing a tug of war between bulls and bears where both are putting their high efforts to take the pairs on their own side. Well the current picture dipicts that bulls both have equal chance from here as bears have momentum with their hand whereas bulls have technical support from here.
Well the way bulls are reacting it seems like they are doing their best and heading north side and they may take the pair to 0.6600 level in near term. Overall pair is trading and sustaining in short term downtrend whereas intermediate term trend is still bullish.
NZD/USD consolidates losses to 0.6395, up 0.15%, during early Wednesday. The pair recently took a U-turn from a horizontal line stretched from November 19. Though, the quote still remains below 61.8% Fibonacci retracement of its October-December 2019 upside.
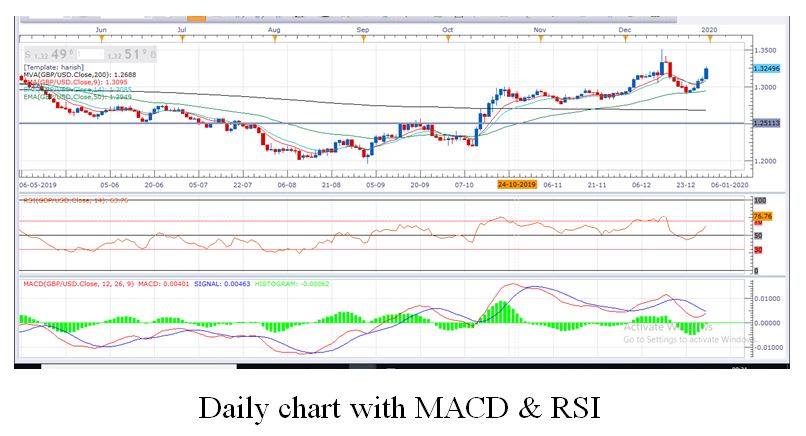
Technical Analysis: – From technical prospective we can see that pair is trading and surviving at 0.6375 which is key support level. By applying the Fibonacci retracement level we can see that it is getting bounce from the 61.8% Fibonacci level. Well today’s closing matter a lot if today bulls able to take the pair above 0.6450 level then it will open the way towards the 0.6600 level in near term.
A short term downtrend line is still intact on the daily chart and a valid breakout of this line will open the way for the bulls or in other words the daily closing above 0.6500 level will open the way towards the 0.6600 level in near term. Overall pair is trading and sustaining between all the minor EMA line. Also, pair recently has given us downside breakout of 200 SMA line, which was a strong key support level on daily chart but now that has been convered into a resistance level.
Well it’s an early call we will get further bullish confirmation once we see massive rally continuation as we are already seen bullish storm in the pair and it bounced from 0.6375 to 0.6400 level.
An upside twist in the RSI is also favoring the bulls and A bullish crossover on the MACD indicator is about to come which will be a recent development as both signal line and macd lines are coming near to each other and trying to give bullish crossover which is favoring the price action.
What Next:- The 0.6450 level is immediate key resistance level followed by 0.6500 level where as 0.6350 level can be considered as key support level followed by 0.6300 level. Odds are in favor of bulls and intraday to weekly bias remains bullish on the pair.
Trade idea:- Based on chart and studies above we would suggest our traders and investors that go for long at current levels i.e. 0.6397-95 level for the target of 0.6530 and 0.6600 with stop loss of 0.6320 level.
Overview:- Well the first view of the daily chart indicates that we are witnessing a tug of war between bulls and bears where both are putting their high efforts to take the pairs on their own side. Well the current picture dipicts that bulls both have equal chance from here as bears have momentum with their hand whereas bulls have technical support from here.
Well the way bulls are reacting it seems like they are doing their best and heading north side and they may take the pair to 0.6600 level in near term. Overall pair is trading and sustaining in short term downtrend whereas intermediate term trend is still bullish.
NZD/USD consolidates losses to 0.6395, up 0.15%, during early Wednesday. The pair recently took a U-turn from a horizontal line stretched from November 19. Though, the quote still remains below 61.8% Fibonacci retracement of its October-December 2019 upside.
Technical Analysis: – From technical prospective we can see that pair is trading and surviving at 0.6375 which is key support level. By applying the Fibonacci retracement level we can see that it is getting bounce from the 61.8% Fibonacci level. Well today’s closing matter a lot if today bulls able to take the pair above 0.6450 level then it will open the way towards the 0.6600 level in near term.
A short term downtrend line is still intact on the daily chart and a valid breakout of this line will open the way for the bulls or in other words the daily closing above 0.6500 level will open the way towards the 0.6600 level in near term. Overall pair is trading and sustaining between all the minor EMA line. Also, pair recently has given us downside breakout of 200 SMA line, which was a strong key support level on daily chart but now that has been convered into a resistance level.
Well it’s an early call we will get further bullish confirmation once we see massive rally continuation as we are already seen bullish storm in the pair and it bounced from 0.6375 to 0.6400 level.
An upside twist in the RSI is also favoring the bulls and A bullish crossover on the MACD indicator is about to come which will be a recent development as both signal line and macd lines are coming near to each other and trying to give bullish crossover which is favoring the price action.
What Next:- The 0.6450 level is immediate key resistance level followed by 0.6500 level where as 0.6350 level can be considered as key support level followed by 0.6300 level. Odds are in favor of bulls and intraday to weekly bias remains bullish on the pair.
Trade idea:- Based on chart and studies above we would suggest our traders and investors that go for long at current levels i.e. 0.6397-95 level for the target of 0.6530 and 0.6600 with stop loss of 0.6320 level.