Overview Massive bullish attempt can be seen in every pair where GBP is the base currency. By observing the daily technical chart we can see that earlier pair was trading and moving in a downtrend and a downtrend line was also lying on the chart which was providing strength to the bears, pair made a steep downfall from 146.50 to 126.50 level continuously without any hurdle.
After arriving at 126.50 level we witnessed a upside movement and few trend reversal candlesticks have been posted on the chart like hammer followed by two consecutive bullish marabuzo candlesticks which is generating bullish signal for upcoming week.
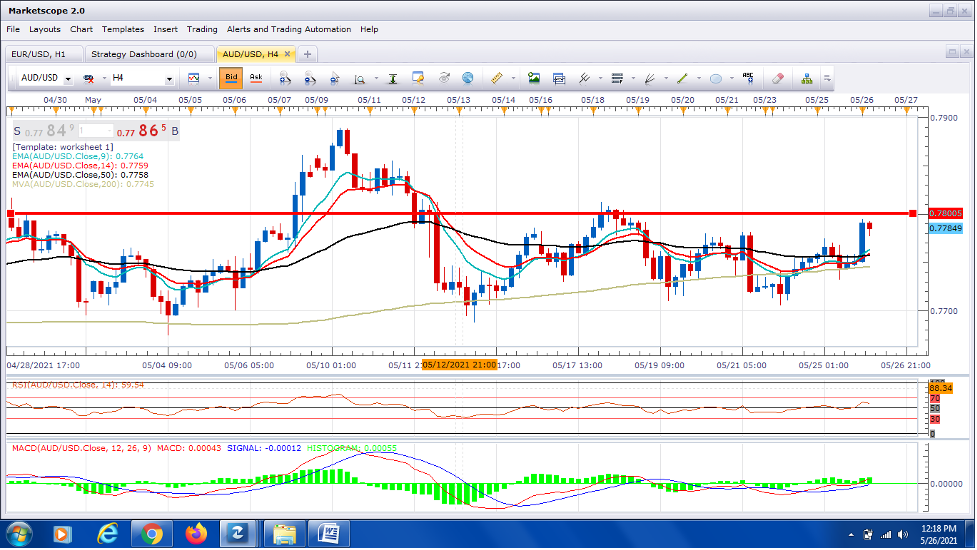
Technical Analysis- The current picture indicates that bears are struggling now and bulls are snatching the bite from bear’s mouth, overall pair is showing bullish momentum and trading above the downtrend line which means that bulls have taken the charge and it will not lose the grip from the market in early phase. A bullish crossover on MACD indicator is favoring the bulls and providing us bullish signal for the time being and RSI is also providing bullish signal from oversold territory. The green dots of parabolic SAR at downside of the candles are favoring the bulls and upper band of Bollinger band is in expansion mode which indicating that bulls are taking it upside with bullish momentum.
What Next- Today’s closing matter a lot, if bulls trades and settles above the 1.3200 then we will get confirmation of trend reversal and we may further upside momentum and we may announce that pair has bottomed out from short term point of view. The way bulls are reacting it seems like a massive rally is on the cards. Well Odds are in favor of bulls and intraday bias remains bullish on the pair as long as 128 levels remain intact. The 134.50 level is immediate resistance level followed by 136.00 whereas 129.00 level is strong key support level followed by 128.00 level.
Trade idea:– Based on chart and study above we would suggest that one can go for long at current levels 131.60-50 level for the target of 134 and 135 for the target of 128 level. A weekly closing above 132 level will confirmation the further buying till 140 in coming weeks.