

By looking at the daily technical chart we can see that gold is heading north side with double bottom price pattern however, earlier pair was heading south side with full

XAGUSD:-Pair turned up from 50% fibonacci level.XAGUSD:-Pair turned up from 50% fibonacci level.
Overview:– By looking at the daily chart we can see that buyers are showing their potential in the market. The market is showing upside momentum in the market. From the

USDJPY:-Bulls are targeting for 170.00 then 172.00 level.USDJPY:-Bulls are targeting for 170.00 then 172.00 level.
Overview:– By looking at the daily chart we can see that buyers are showing their potential in the market. The market is showing upside momentum in the market. From the

EURAUD:- Bulls are spring back to north side from 50 EMA line.EURAUD:- Bulls are spring back to north side from 50 EMA line.
Overview:- By analyzing the daily technical chart we can see that pair is heading north side and marked a high of 1.5710 which means it is rising up with a

GERMAN30:- A FLAG PATTERN PROVIDING STRENGHT TO BULLS.GERMAN30:- A FLAG PATTERN PROVIDING STRENGHT TO BULLS.
Overview:– By looking at the daily chart we can see that buyers are showing their potential in the market. The market is showing upside momentum in the market. From the

USDJPY:-Pair is heading south side with full of bearish momentum.USDJPY:-Pair is heading south side with full of bearish momentum.
Overview:- By analyzing at the daily chart we can see that pair is making successively lower lows and lower highs where only bears are showing their full strength and they

CADJPY:- Bears are dominating the bulls at heading southCADJPY:- Bears are dominating the bulls at heading south
Overview:- By analyzing at the daily chart we can see that pair is making successively lower lows and lower highs where only bears are showing their full strength and they
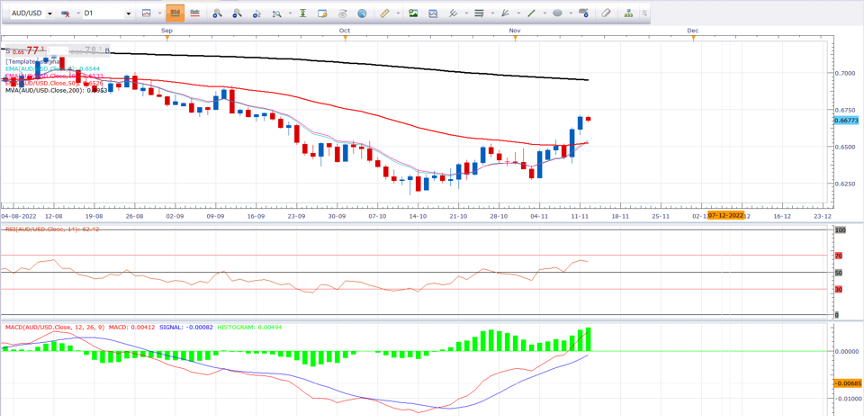
AUDUSD:-Bulls are driving the car & heading for long drive.AUDUSD:-Bulls are driving the car & heading for long drive.
Overview:– By looking at the daily chart we can see that buyers are showing their potential in the market. The market is showing upside momentum in the market. From the

USDCHF:- Bears are dominating the bulls at heading southUSDCHF:- Bears are dominating the bulls at heading south
Overview:- By analyzing at the daily chart we can see that pair is making successively lower lows and lower highs where only bears are showing their full strength and they

EURCAD:- Bulls are spring back to north side from 50 EMA line.EURCAD:- Bulls are spring back to north side from 50 EMA line.
Overview:- By analyzing the daily technical chart we can see that pair is heading north side and marked a high of 0.7200 which means it is rising up with a