

Overview:– By looking at the daily chart we can see that buyers are showing their potential in the market. The market is showing upside momentum in the market. From the

GBPUSD:-Bulls are driving the care & heading for long drive.GBPUSD:-Bulls are driving the care & heading for long drive.
Overview:– By looking at the daily chart we can see that buyers are showing their potential in the market. The market is showing upside momentum in the market. From the

EURNZD:- Pair has given breakout of key resistance level .EURNZD:- Pair has given breakout of key resistance level .
Overiview :-From past couple of days we are witnessing very narrow range move in the pair and the way pair is moving on it seems like tug of war is

GBPCAD:-A rounding bottom pattern running providing strength to bulls.GBPCAD:-A rounding bottom pattern running providing strength to bulls.
Overview:-By looking at the daily technical chart we can see that gold is heading north side with double bottom price pattern however, earlier pair was heading south side with full

GERMAN30:- Bulls are again taking upside movementGERMAN30:- Bulls are again taking upside movement
Overview: By looking at the daily chart we can see that buyers are showing their potential in the market. The market is showing upside momentum in the market. From the

EURCHF:-Bullish attack at support level after a steep downfallEURCHF:-Bullish attack at support level after a steep downfall
By looking at the daily technical chart we can see that earlier pair was heading south side with full of bearish momentum and breaking all the major and minor support

GOLD :- Bulls are are driving the car ,just sit for long driveGOLD :- Bulls are are driving the car ,just sit for long drive
Overview:- By analyzing the daily technical chart we can see that bulls are doing their best and heading to north side. Overall pair is now trading in uptrend and in

NZDCAD:- Bulls are spring back to north side from 50 EMA line.NZDCAD:- Bulls are spring back to north side from 50 EMA line.
Overview:– By analyzing the daily technical chart we can see that pair is heading north side and marked a high of 0.8815 which means it is rising up with a
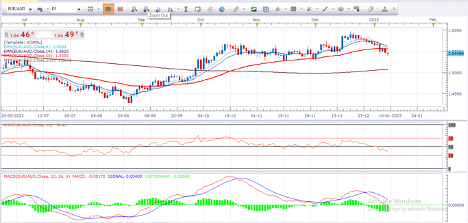
EURAUD:-Bears are taking the charge & heading south.EURAUD:-Bears are taking the charge & heading south.
Overview:- By analyzing at the daily chart we can see that pair is making successively lower lows and lower highs where only bears are showing their full strength and they

USDJPY:-A double bottom pattern providing strength to bulls.USDJPY:-A double bottom pattern providing strength to bulls.
Overiew:-By looking at the daily technical chart we can see that pair is heading north side with tripple bottom price pattern however, earlier pair was heading south side with full