

Overview:– By looking at the daily chart we can see that buyers are showing their potential in the market. The market is showing upside momentum in the market. From the
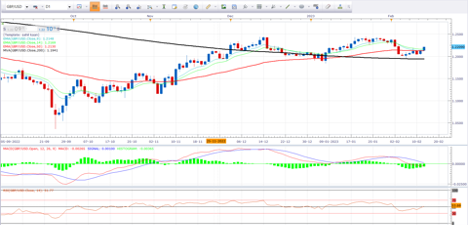
GBPUSD:-Bulls are spring back to north side form 200 EMA line.GBPUSD:-Bulls are spring back to north side form 200 EMA line.
Overview:– By looking at the daily chart we can see that buyers are showing their potential in the market. The market is showing upside momentum in the market. From the technical

GERMAN30:- Trend reversal overbought suggest us to shortGERMAN30:- Trend reversal overbought suggest us to short
Overview:– Pair is showing too much volatility and heading towards north side and marked a high of 15660 but the journey was started from 13688 level and since the accessively

EURUSD:- Massive bullish storm from bulls side can be seen.EURUSD:- Massive bullish storm from bulls side can be seen.
Overview:– By looking at the daily chart we can see that buyers are showing their potential in the market. The market is showing upside momentum in the market. From the technical

USOIL:-A double bottom pattern providing strength to bulls.USOIL:-A double bottom pattern providing strength to bulls.
Overview:-By looking at the daily technical chart we can see that pair is heading north side with double bottom price pattern however, earlier pair was heading south side with full

GOLD:-Bulls are spring back to north side form 50 EMA line.GOLD:-Bulls are spring back to north side form 50 EMA line.
Overview:- By analyzing the daily technical chart we can see that pair is heading north side and marked a high of 1959.92$ which means it is rising up with a

EURNZD:- Pair has given breakout of key resistance level.EURNZD:- Pair has given breakout of key resistance level.
Overview:– By looking at the daily chart we can see that buyers are showing their potential in the market. The market is showing upside momentum in the market. From the

GBPNZD:- Free fall in the pair, bears are leading in the gameGBPNZD:- Free fall in the pair, bears are leading in the game
Overview:- By looking at the daily chart we can see that bears are rocking and it seems like they are in party mood. The pair has topped out and shown

USDJPY:-Pair is falling down with downtrend line.USDJPY:-Pair is falling down with downtrend line.
Overview:-By analyzing the daily technical chart we can see that pair is falling down and heading south side. Bears are taking the control on the pair and playing at the

USDCAD:-USDCAD is heading south side with full of bearish momentum.USDCAD:-USDCAD is heading south side with full of bearish momentum.
Overview:- By analyzing at the daily chart we can see that pair is making successively lower lows and lower highs where only bears are showing their full strength and they