A potential bearish movement on Nikkei 225A potential bearish movement on Nikkei 225
The price of Nikkei 225 in heading back to the support area. It is possible that it will struggle to break through it and move back in the other direction.
Technical Analysis
The price of Nikkei 225 in heading back to the support area. It is possible that it will struggle to break through it and move back in the other direction.
USDJPY is moving towards a resistance line which it has tested numerous times in the past. We have seen it retrace from this line before, so at this stage it
The movement of AUDUSD towards 0.6677 price line is yet another test of the line it reached numerous times in the past. We could expect this test to happen in
FTSE 100 moved through the support line of a Triangle at 8429.73953488372 on the 4 hour chart. This line has been tested a number of times in the past and
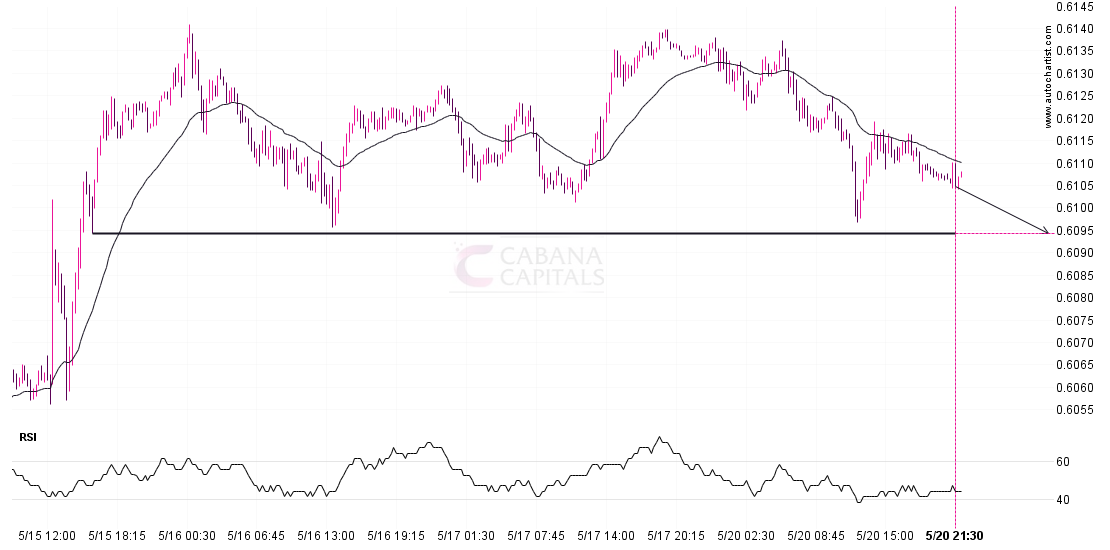
NZDUSD is en route to a very important line that will be a definite deciding factor of what is to come! We may see this trajectory continue to touch and
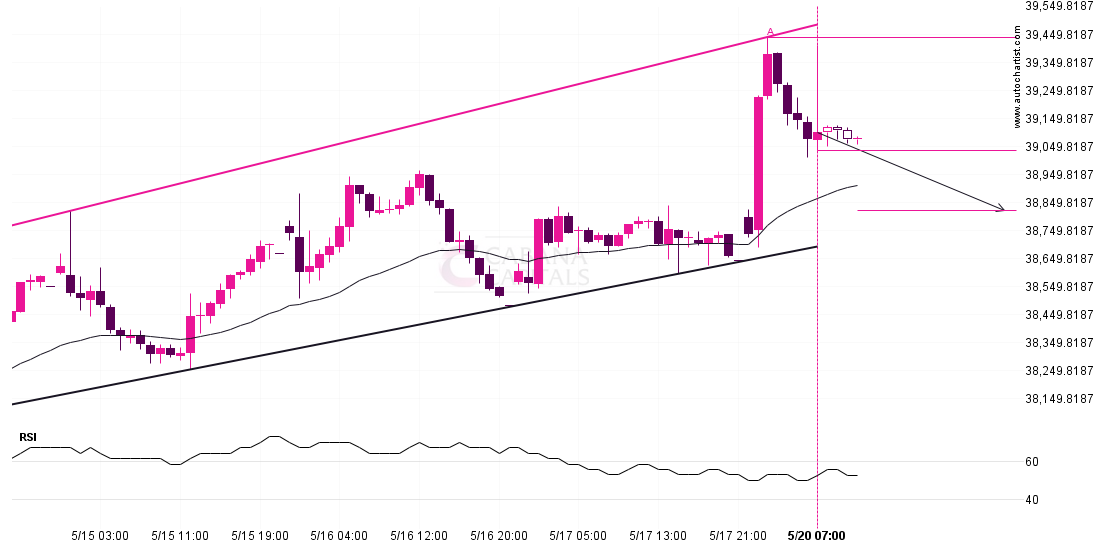
The movement of Nikkei 225 towards the support line of a Channel Up is yet another test of the line it reached numerous times in the past. This line test
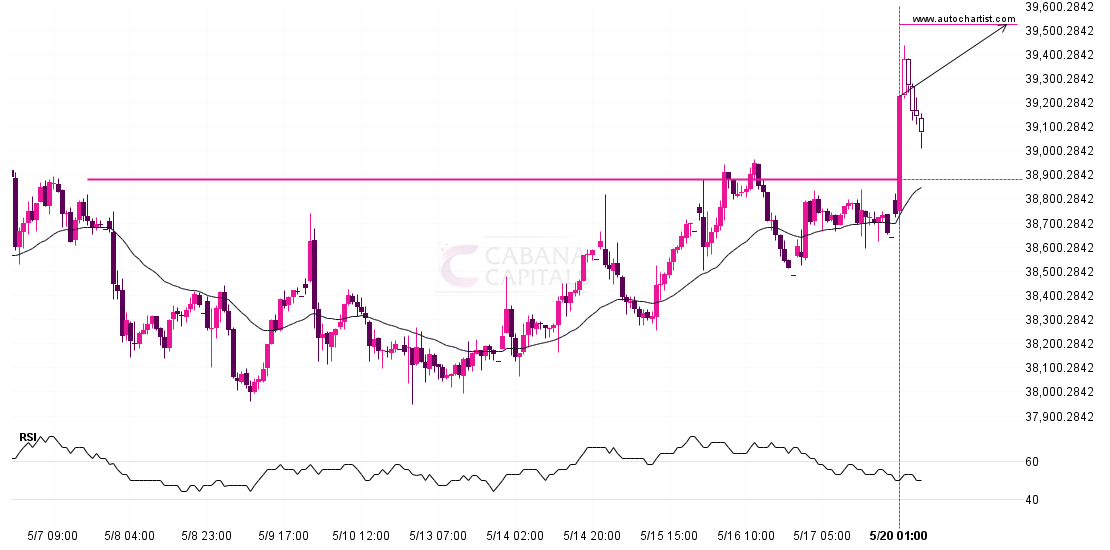
Nikkei 225 has broken through a line of 38882.0000. If this breakout holds true, we could see the price of Nikkei 225 heading towards 39521.6992 within the next 2 days.
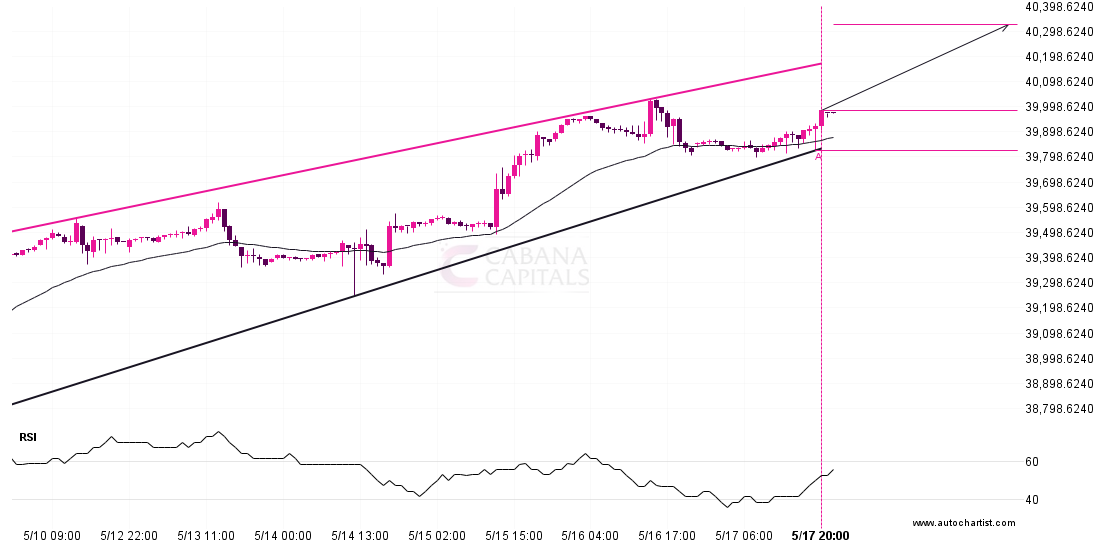
An emerging Rising Wedge has been detected on DOW 30 on the 1 hour chart. There is a possible move towards 40323.2941 next few candles. Once reaching support it may
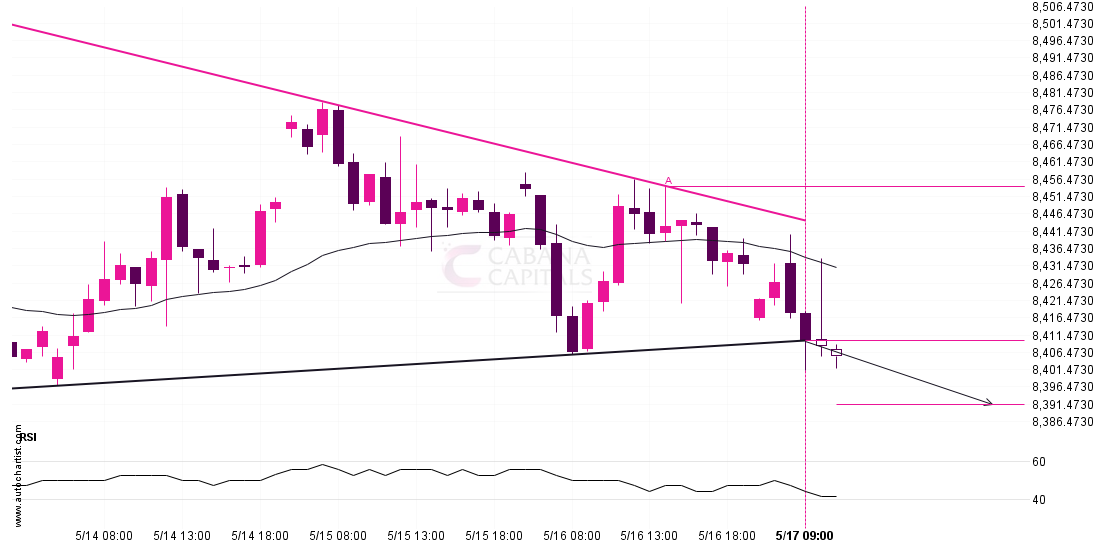
FTSE 100 has broken through the support line which it has tested twice in the past. We have seen it retrace from this line before, so one should wait for
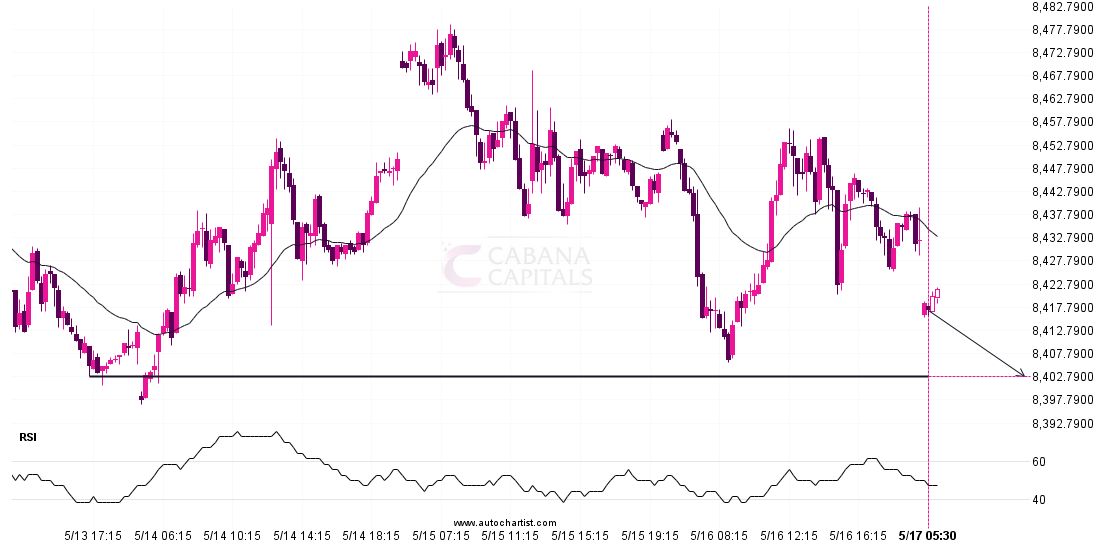
FTSE 100 is en route to a very important line that will be a definite deciding factor of what is to come! We may see this trajectory continue to touch