Possible breach of support level by DAX 40Possible breach of support level by DAX 40
The movement of DAX 40 towards the support line of a Triangle is yet another test of the line it reached numerous times in the past. This line test could
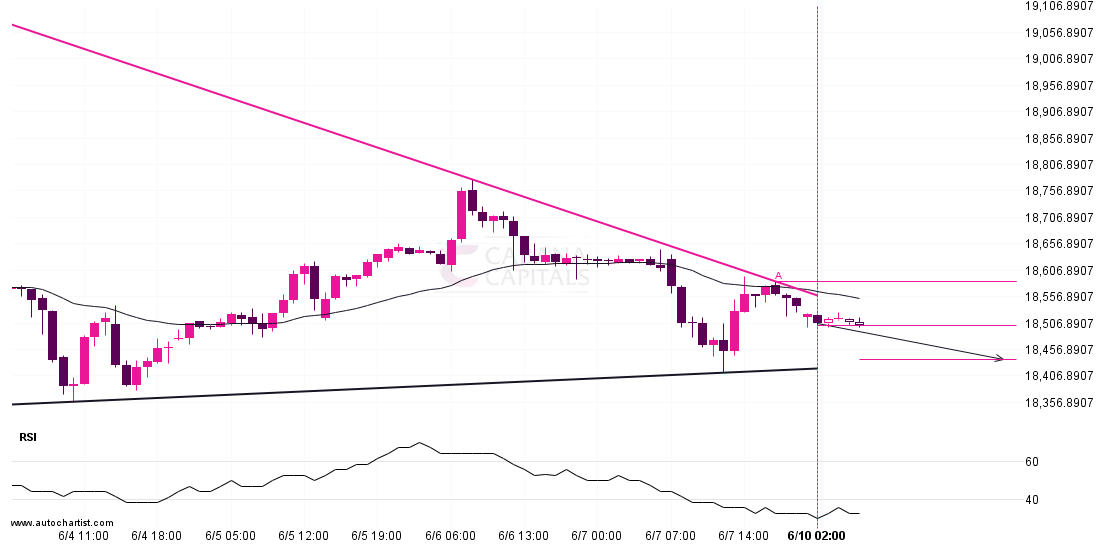
The movement of DAX 40 towards the support line of a Triangle is yet another test of the line it reached numerous times in the past. This line test could
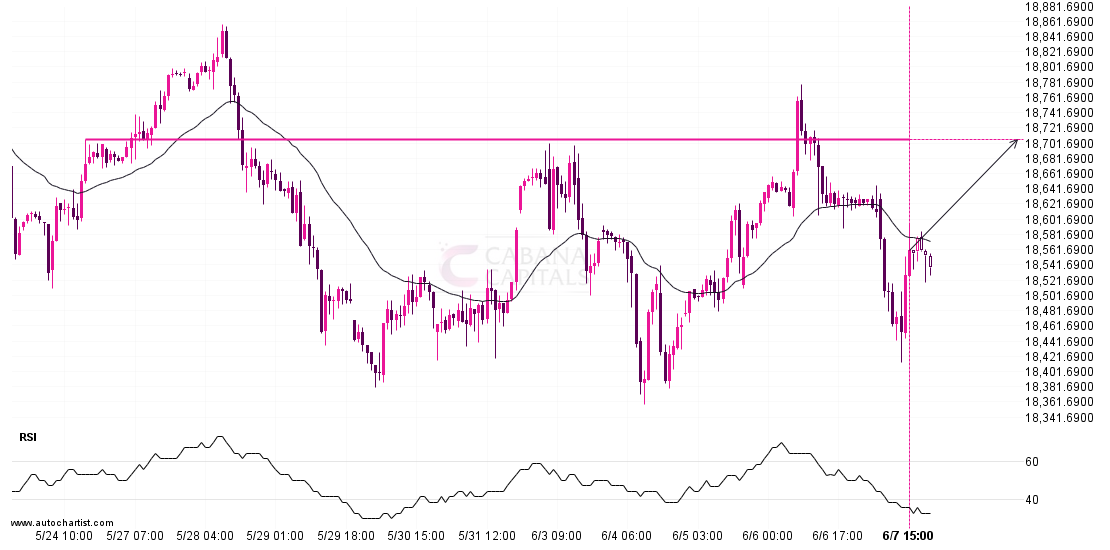
DAX 40 is heading towards a line of 18707.0000. If this movement continues, the price of DAX 40 could test 18707.0000 within the next 2 days. But don’t be so
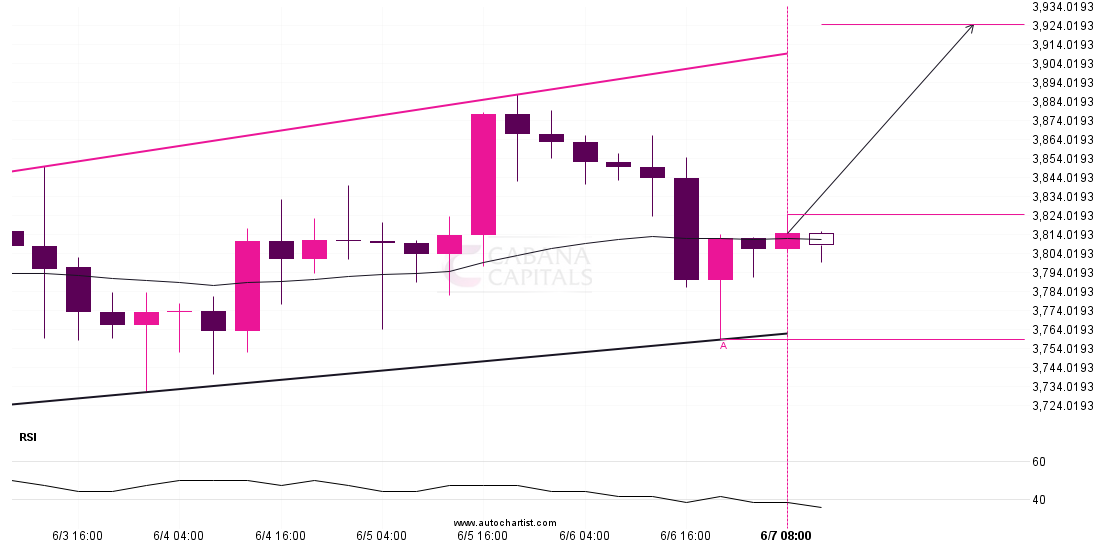
ETHUSD was identified at around 3824.62 having recently rebounded of the support on the 4 hour data interval. Ultimately, the price action of the stock has formed a Channel Up
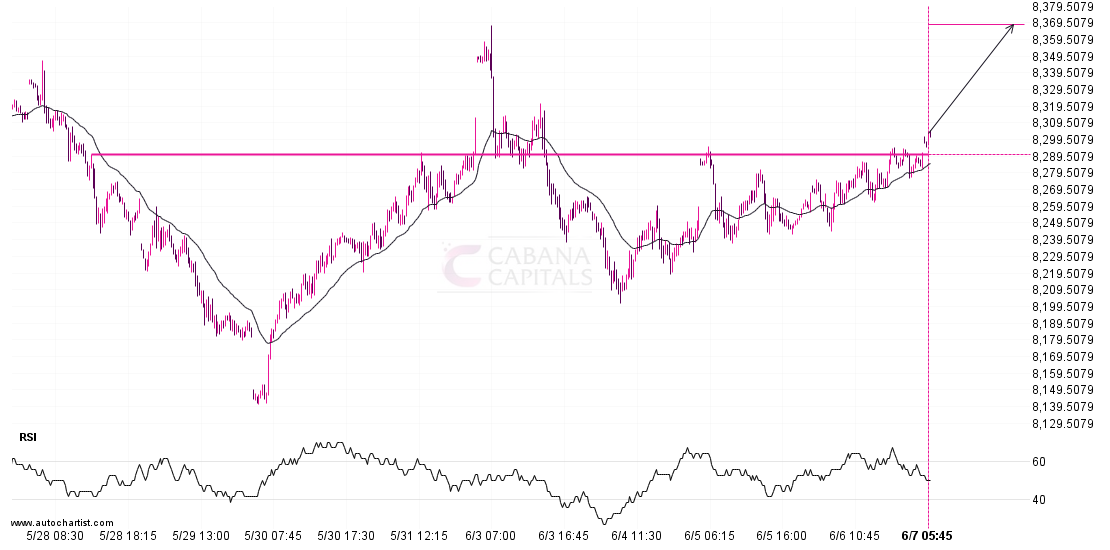
FTSE 100 has broken through a resistance line. Because we have seen it retrace from this price in the past, one should wait for confirmation of the breakout before trading.
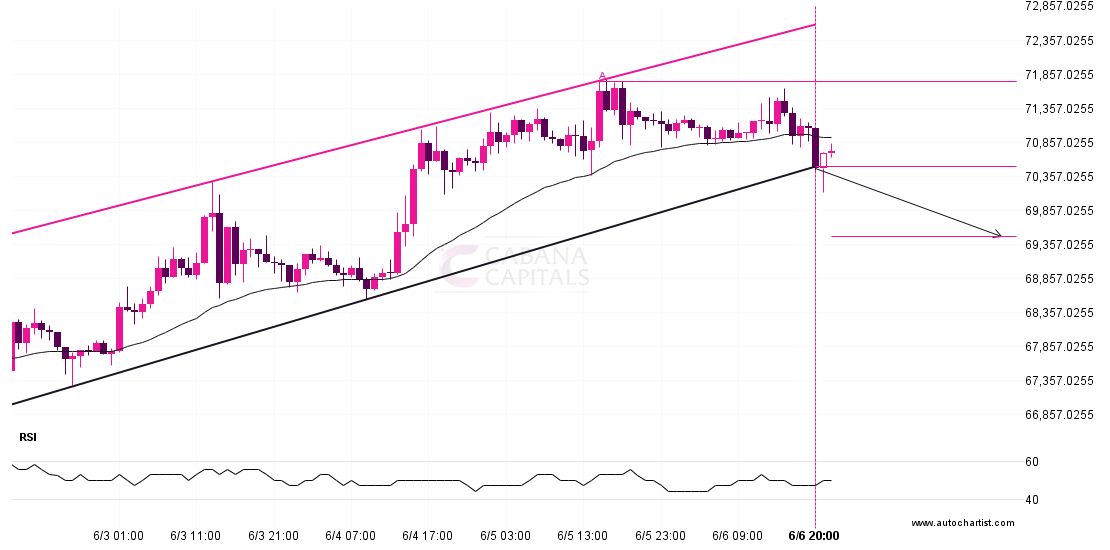
The breakout of BTCUSD through the support line of a Channel Up could be a sign of the road ahead. If this breakout persists, we may see the price of
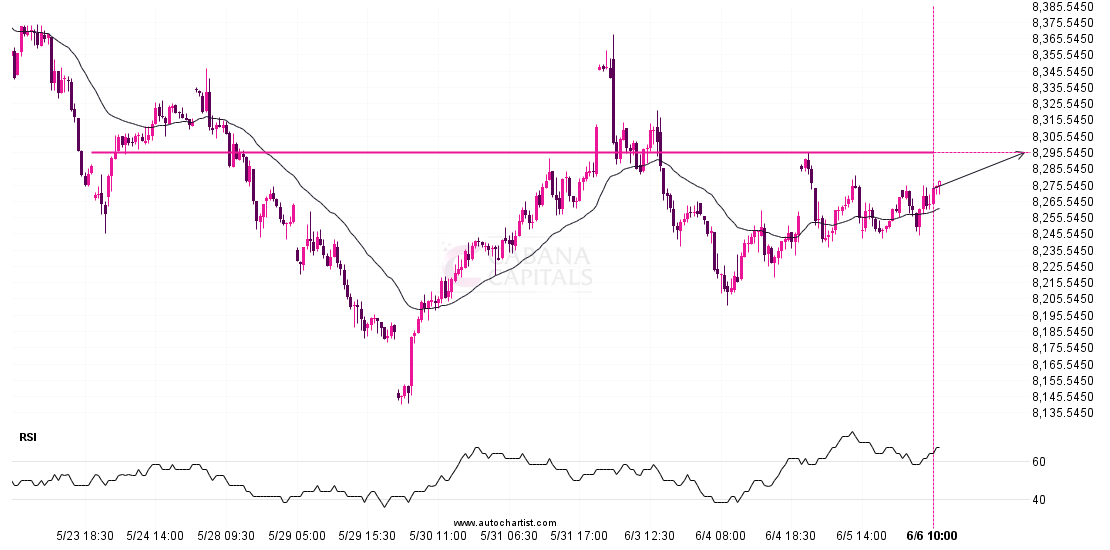
The price of FTSE 100 in heading back to the resistance area. It is possible that it will struggle to break through it and move back in the other direction.
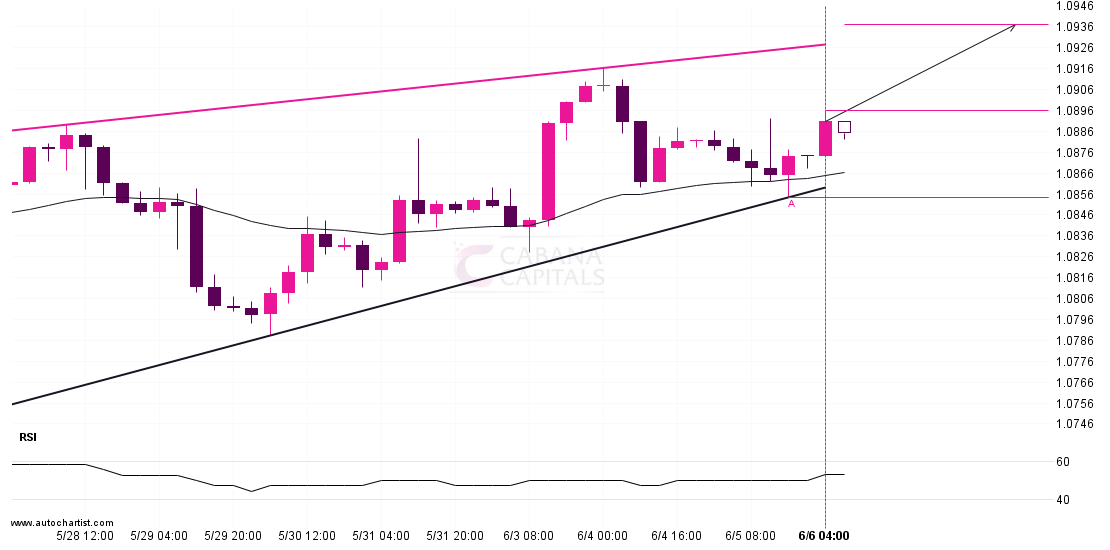
Emerging Rising Wedge pattern in its final wave was identified on the EURUSD 4 hour chart. After a strong bullish run, we find EURUSD heading towards the upper triangle line
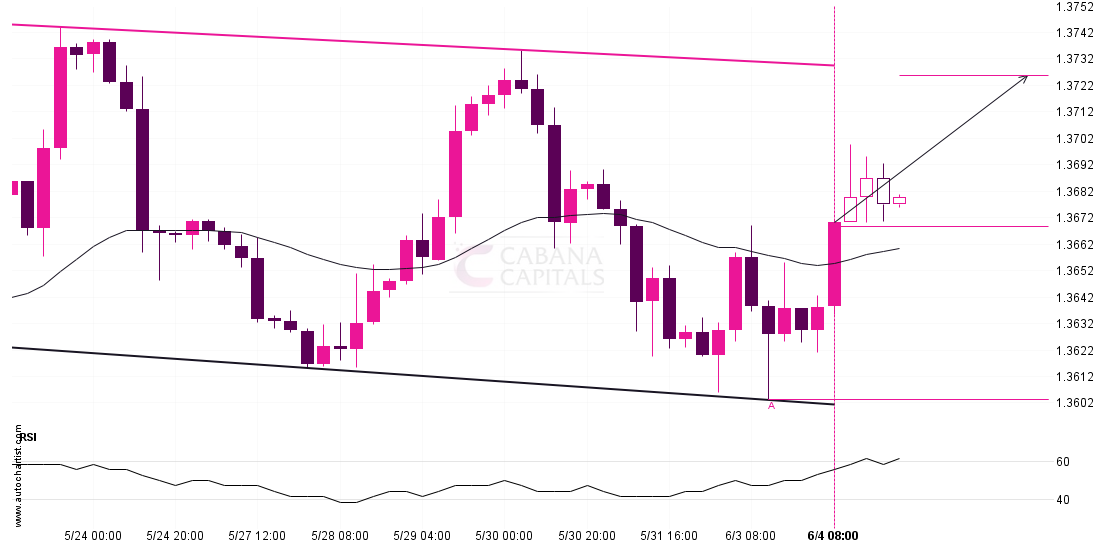
Emerging Channel Down detected on USDCAD – the pattern is an emerging one and has not yet broken through support, but the price is expected to move up over the
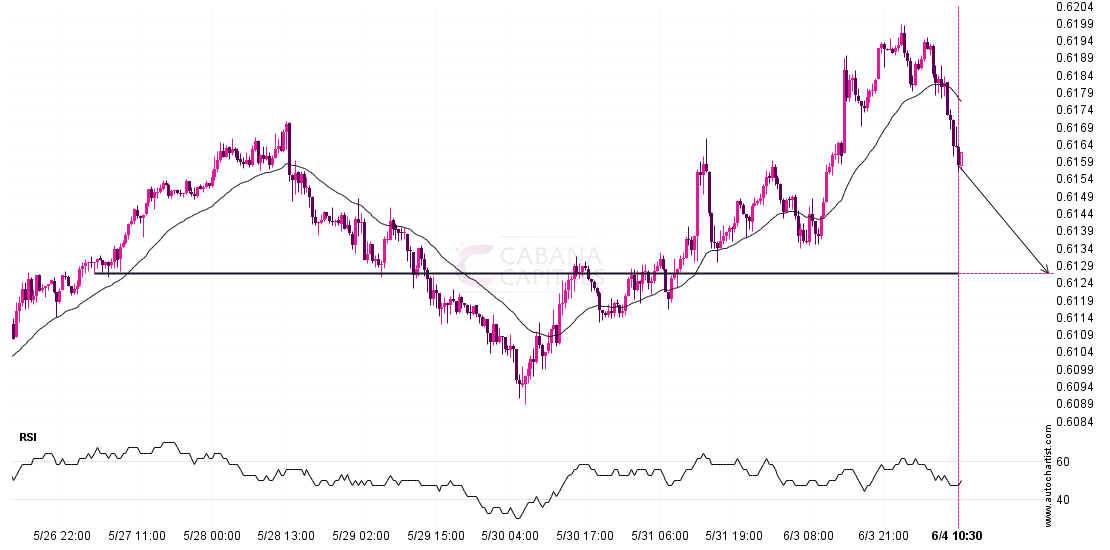
A strong support level has been identified at 0.6126 on the 30 Minutes NZDUSD chart. NZDUSD is likely to test it soon. Supported by Downward sloping Moving Average Target: 0.6126
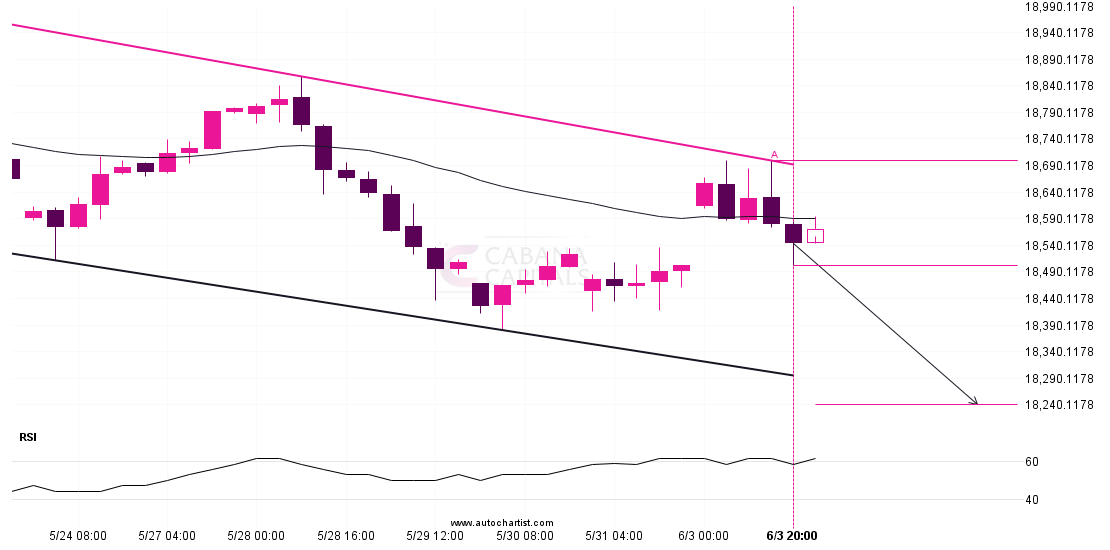
DAX 40 is moving towards a support line. Because we have seen it retrace from this line before, we could see either a break through this line, or a rebound