bearish technical pattern on USDJPY 4 hourbearish technical pattern on USDJPY 4 hour
USDJPY has broken through a support line of a Channel Up chart pattern. If this breakout holds true, we may see the price of USDJPY testing 155.4309 within the next

USDJPY has broken through a support line of a Channel Up chart pattern. If this breakout holds true, we may see the price of USDJPY testing 155.4309 within the next

Overview: By looking at the daily chart we can see that buyers are showing their potential in the market. The market is showing upside momentum in the market. From the

DAX 40 is moving towards a line of 18551.8008 which it has tested numerous times in the past. We have seen it retrace from this position in the past, so
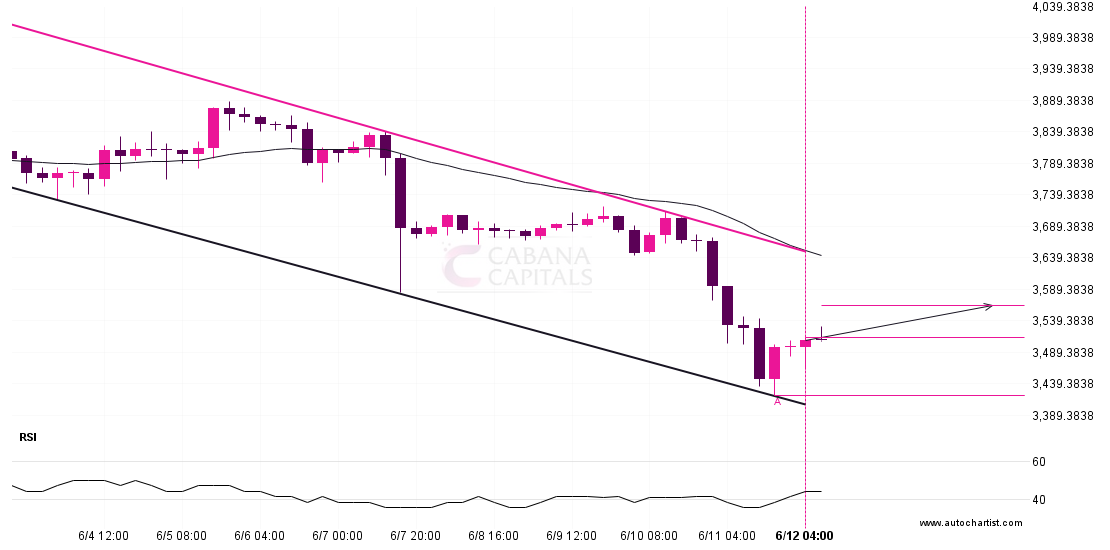
ETHUSD is heading towards the resistance line of a Channel Down and could reach this point within the next 3 days. It has tested this line numerous times in the
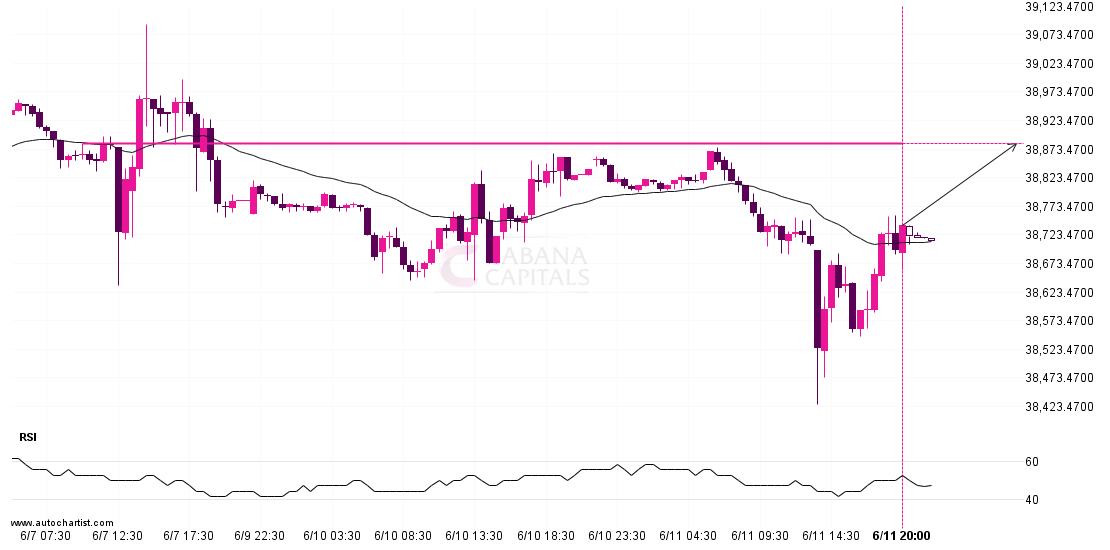
The movement of DOW 30 towards 38882.7813 price line is yet another test of the line it reached numerous times in the past. We could expect this test to happen
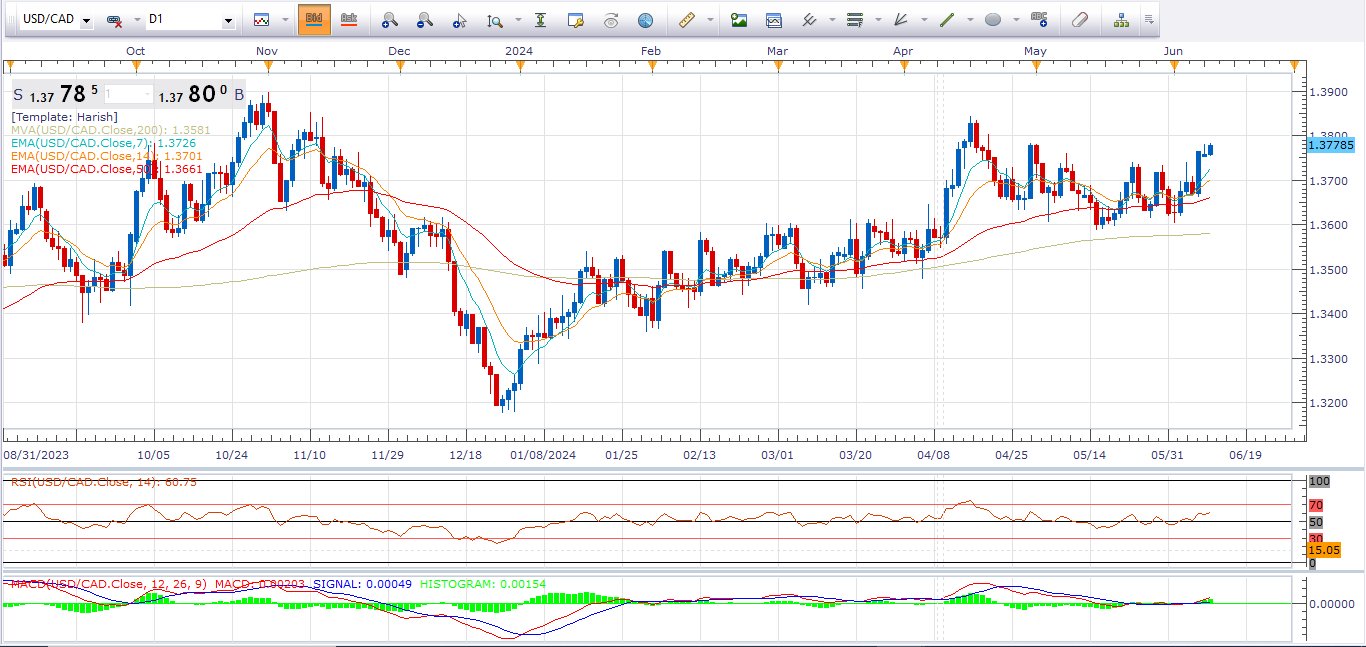
Overview:–By looking at the daily chart we can see that buyers are showing their potential in the market. The market is showing upside momentum in the market. From the technical
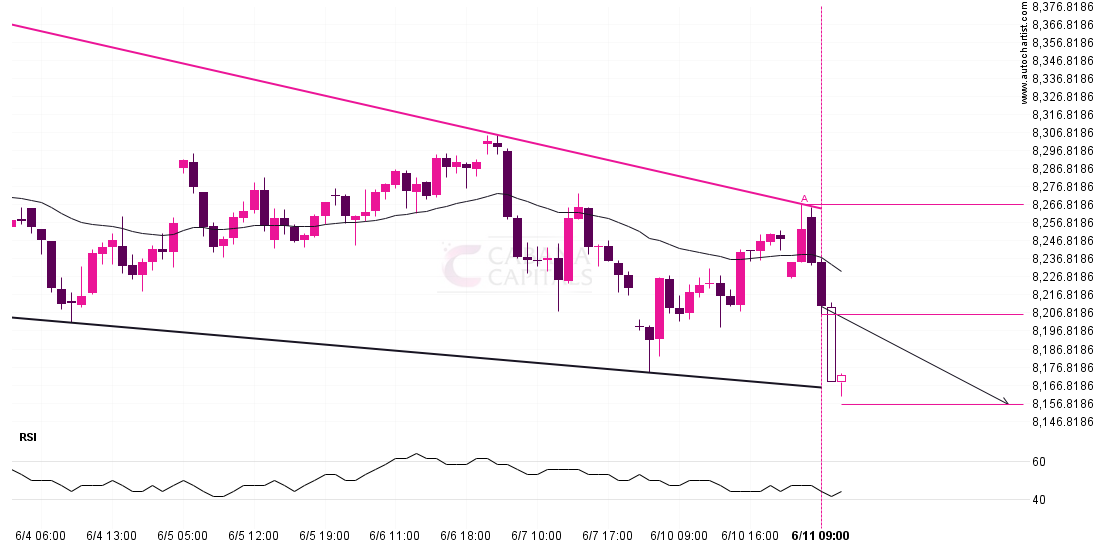
FTSE 100 is moving towards a support line which it has tested numerous times in the past. We have seen it retrace from this line before, so at this stage
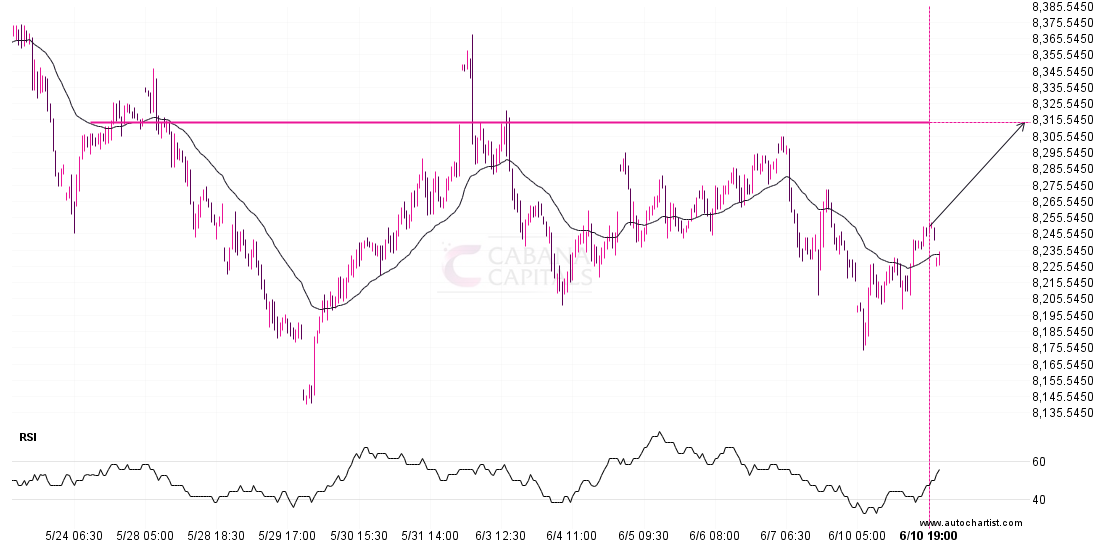
FTSE 100 is about to retest a key horizontal resistance level near 8313.9004. It has tested this level 5 times in the recent past and could simply bounce off like
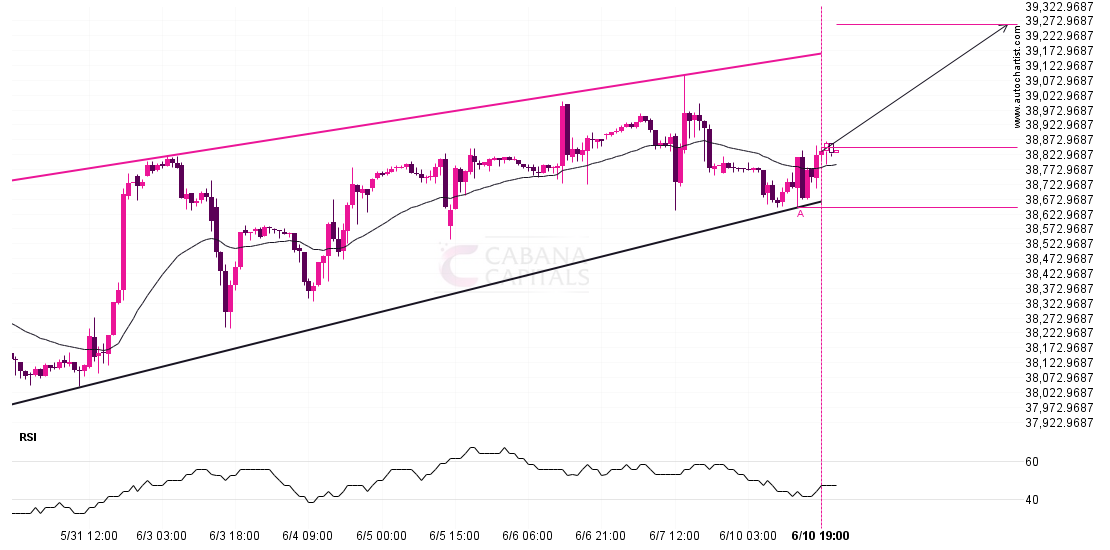
DOW 30 is trapped in a Rising Wedge formation, implying that a breakout is Imminent. This is a great trade-setup for both trend and swing traders. It is now approaching

The price of ETHUSD in heading in the direction of 3635.5559. Despite the recent breakout through 3670.1001 it is possible that it will struggle to gain momentum to the forecast