A final push possible on LTCUSDA final push possible on LTCUSD
LTCUSD is moving towards a key resistance level at 70.5200. This is a previously tested level for LTCUSD. This could be a good trading opportunity, either at the spot price,

LTCUSD is moving towards a key resistance level at 70.5200. This is a previously tested level for LTCUSD. This could be a good trading opportunity, either at the spot price,
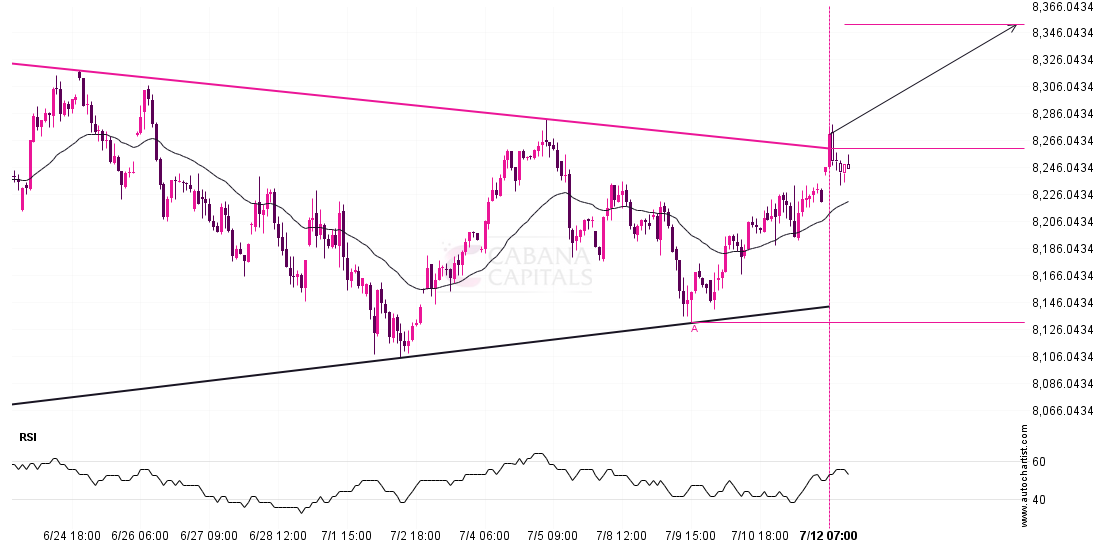
Triangle pattern identified on FTSE 100 has broken through a resistance level with the price momentum continuing to move in an upward direction. A solid trading opportunity continues with the
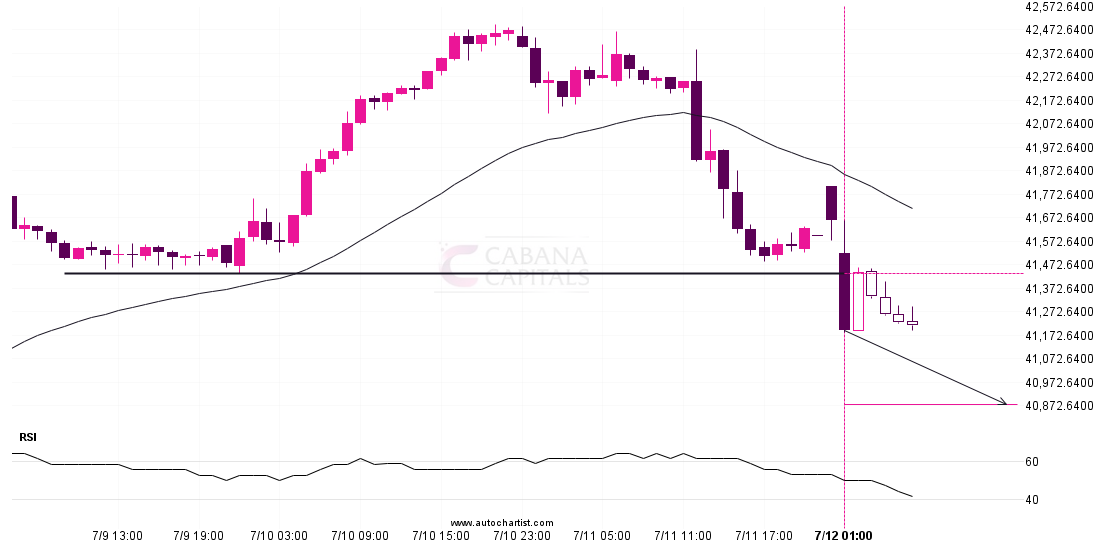
Nikkei 225 has broken through 41435.0000 which it has tested numerous times in the past. We have seen it retrace from this price in the past. If this new trend
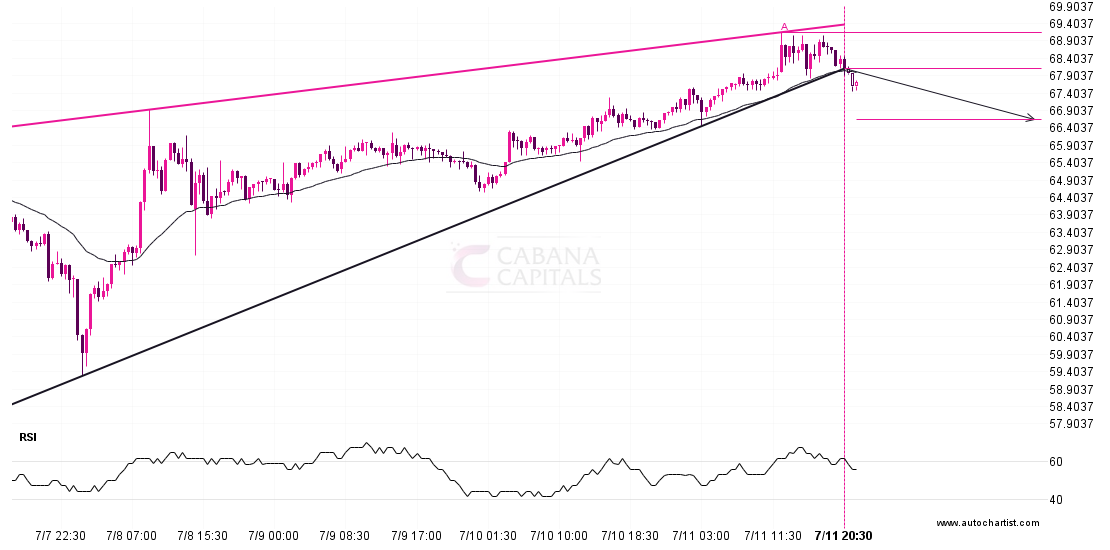
LTCUSD has broken through a support line of a Rising Wedge and suggests a possible movement to 66.6559 within the next 2 days. It has tested this line in the

Overview:–By looking at the daily chart we can see that buyers are showing their potential in the market. The market is showing upside momentum in the market. From the technical

The movement of ETHUSD towards 3168.1699 price line is yet another test of the line it reached numerous times in the past. We could expect this test to happen in
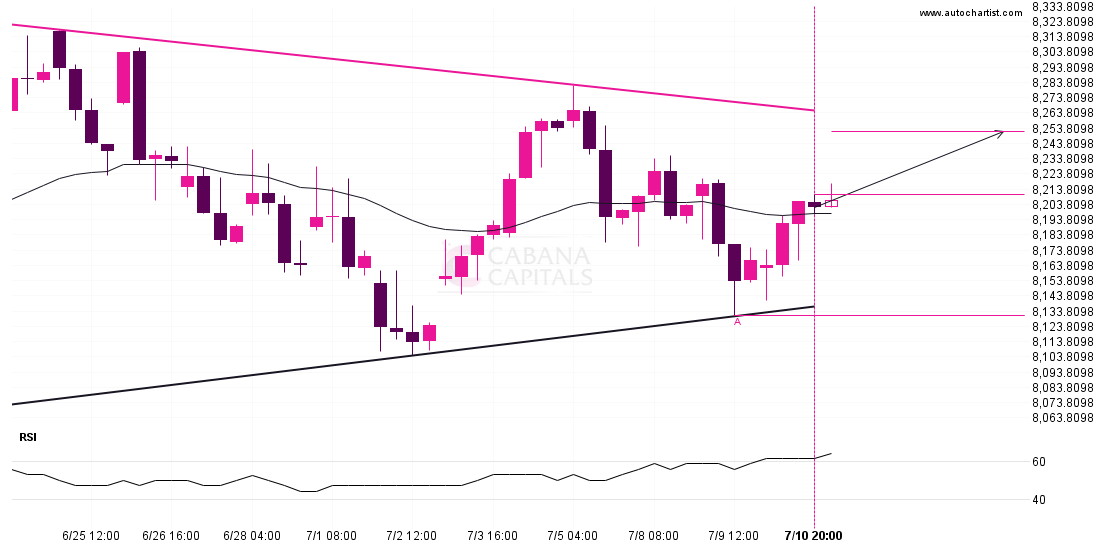
FTSE 100 is approaching the resistance line of a Triangle. It has touched this line numerous times in the last 20 days. If it tests this line again, it should
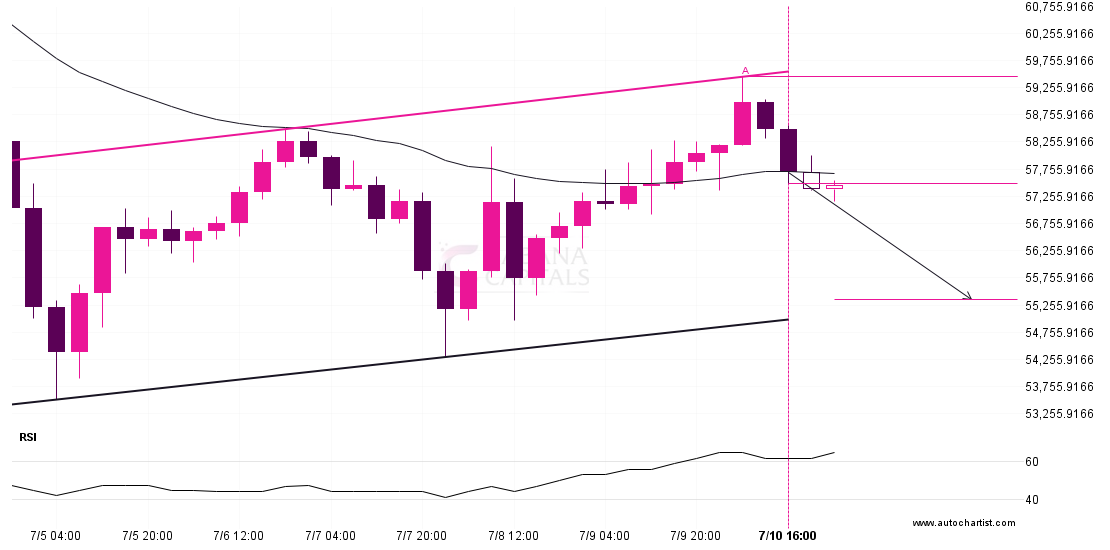
A Channel Up pattern was identified on BTCUSD at 57492.31, creating an expectation that it may move to the support line at 55356.3018. It may break through that line and
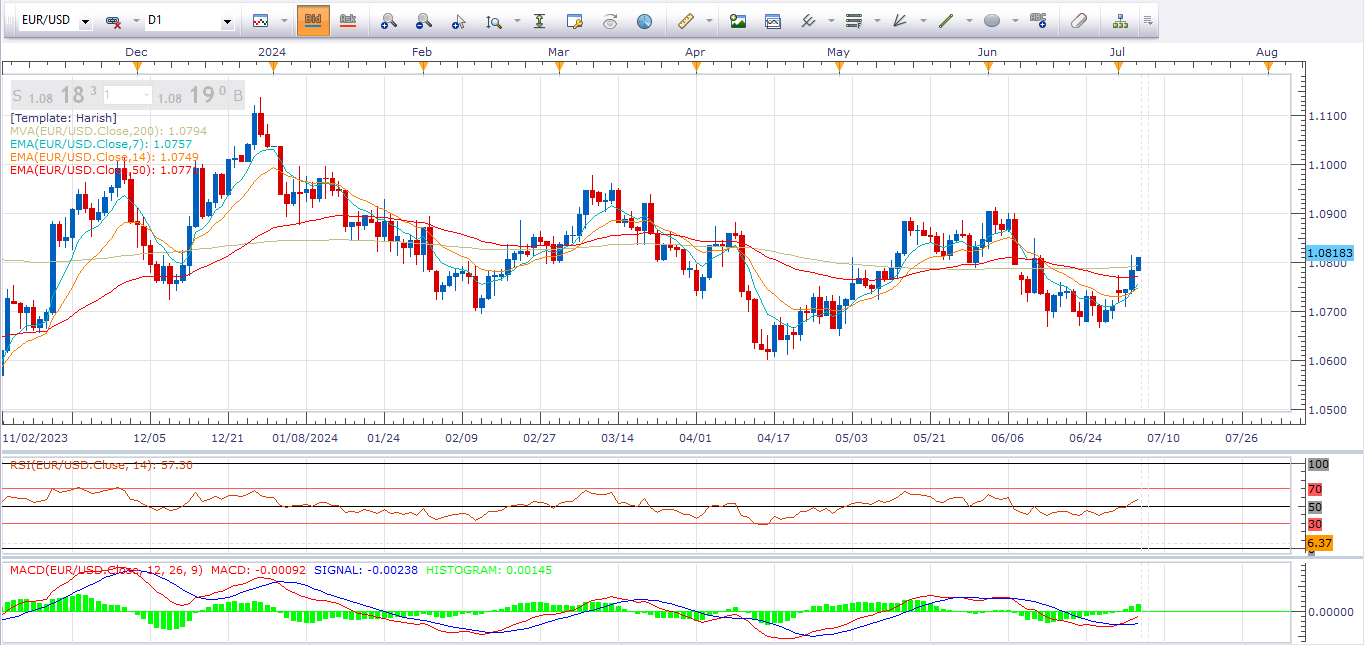
Overview: By looking at the daily chart we can see that buyers are showing their potential in the market. The market is showing upside momentum in the market. From the
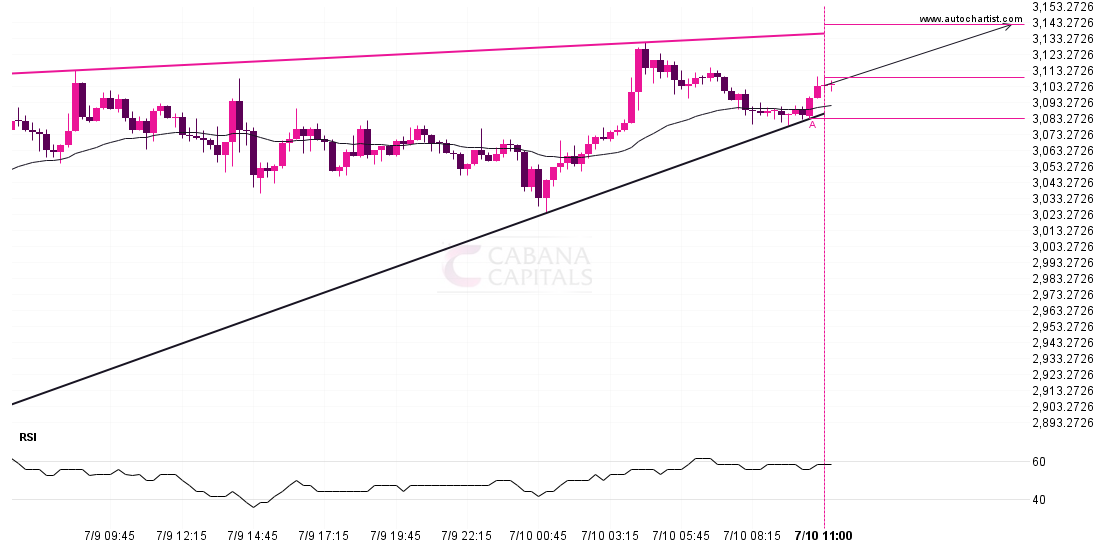
A Rising Wedge pattern was identified on ETHUSD at 3108.66, creating an expectation that it may move to the resistance line at 3141.4495. It may break through that line and