GBPUSD – psychological price line breachedGBPUSD – psychological price line breached
GBPUSD has broken through 1.2899 which it has tested numerous times in the past. We have seen it retrace from this price in the past. If this new trend persists,

GBPUSD has broken through 1.2899 which it has tested numerous times in the past. We have seen it retrace from this price in the past. If this new trend persists,
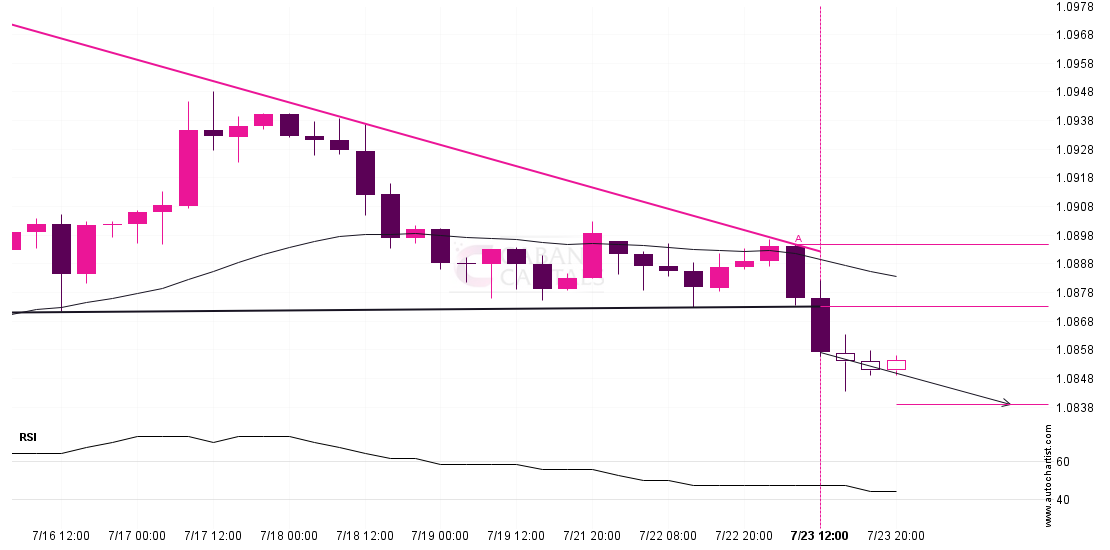
Descending Triangle pattern identified on EURUSD has broken through a support level with the price momentum continuing to move in an downward direction. A solid trading opportunity continues with the

Overview: By looking at the daily chart we can see that sellers are showing their potential in the market. The market is showing downside momentum in the market. From the
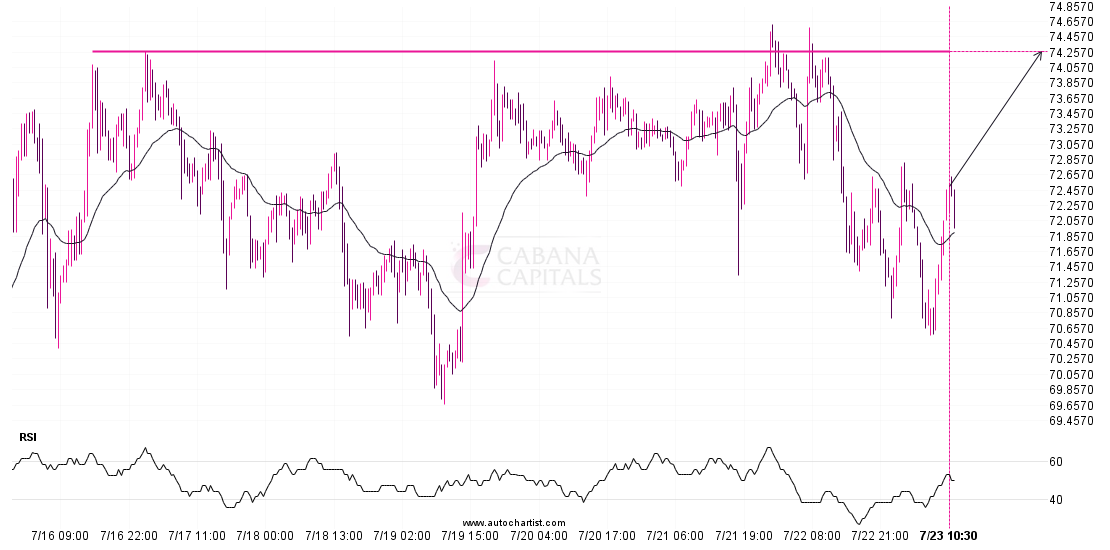
The movement of LTCUSD towards 74.2700 price line is yet another test of the line it reached numerous times in the past. We could expect this test to happen in
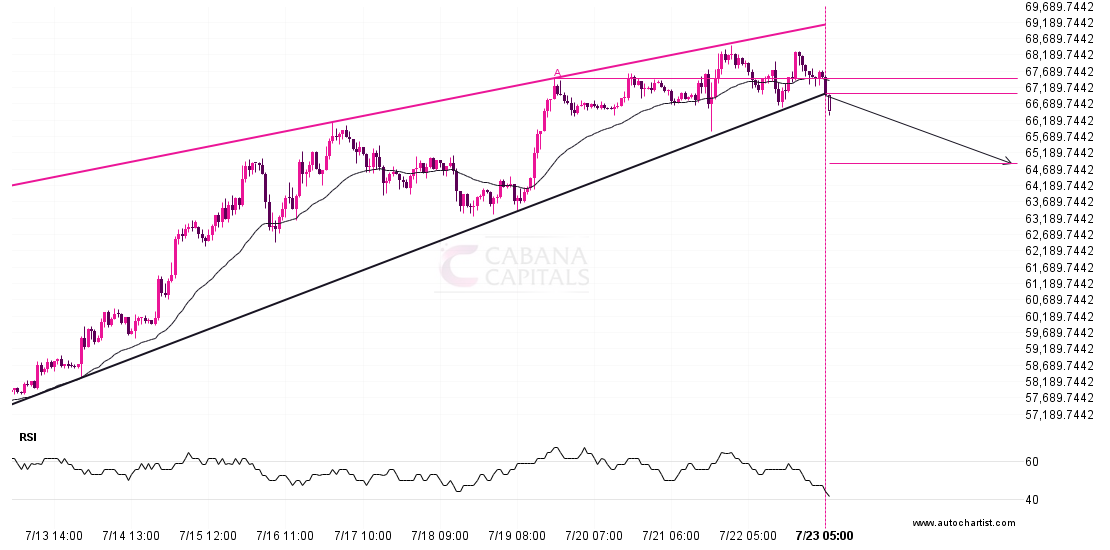
BTCUSD has broken through a support line of a Rising Wedge and suggests a possible movement to 64858.2079 within the next 4 days. It has tested this line in the
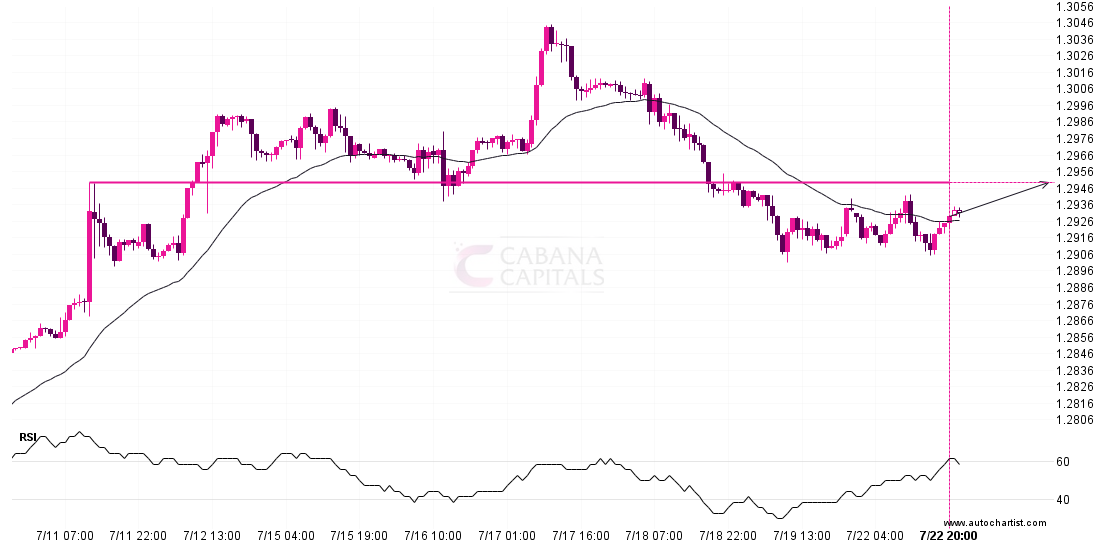
GBPUSD is moving towards a resistance line. Because we have seen it retrace from this level in the past, we could see either a break through this line, or a
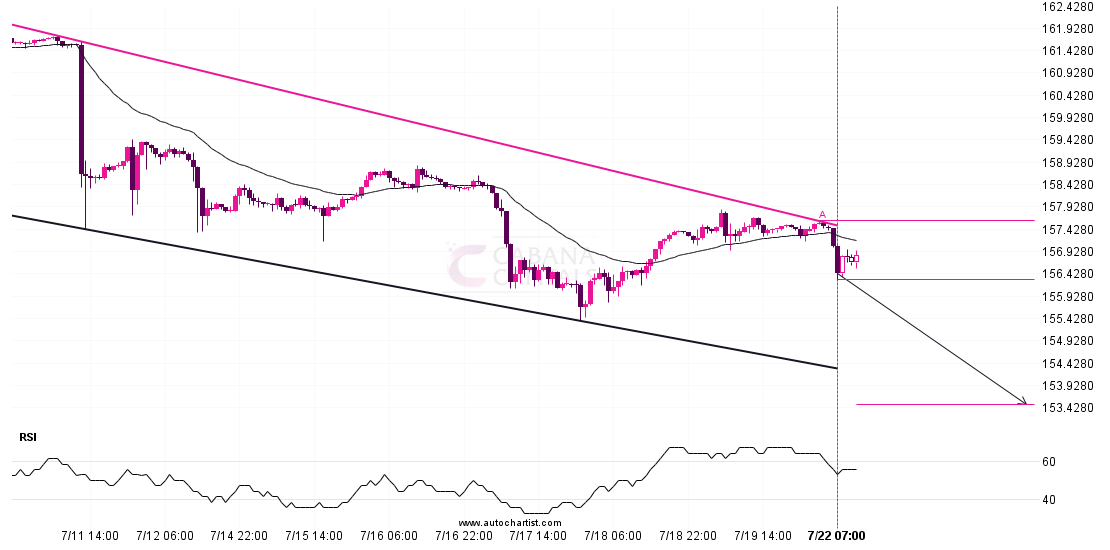
USDJPY is heading towards the support line of a Channel Down. If this movement continues, the price of USDJPY could test 153.5149 within the next 3 days. It has tested

General overview: – By looking at the daily along with hourly chart we can see that the pair hits the lows highs in the market and bears have given us
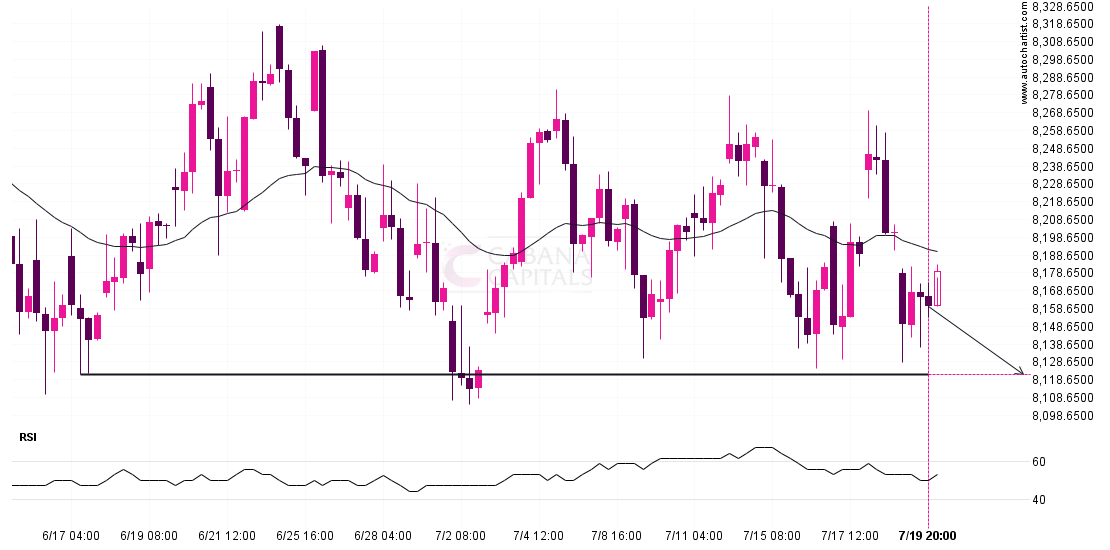
FTSE 100 is en route to a very important line that will be a definite deciding factor of what is to come! We may see this trajectory continue to touch
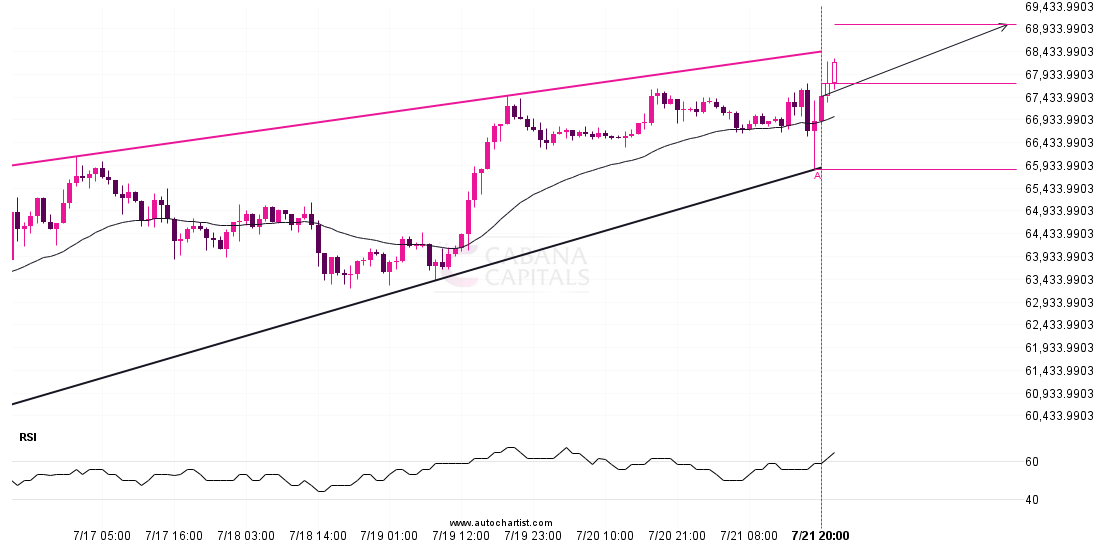
BTCUSD is moving towards a resistance line. Because we have seen it retrace from this line before, we could see either a break through this line, or a rebound back