Support breakout on USDCHFSupport breakout on USDCHF
USDCHF has broken through a line of 0.8647 and suggests a possible movement to 0.8612 within the next 7 hours. It has tested this line numerous times in the past,
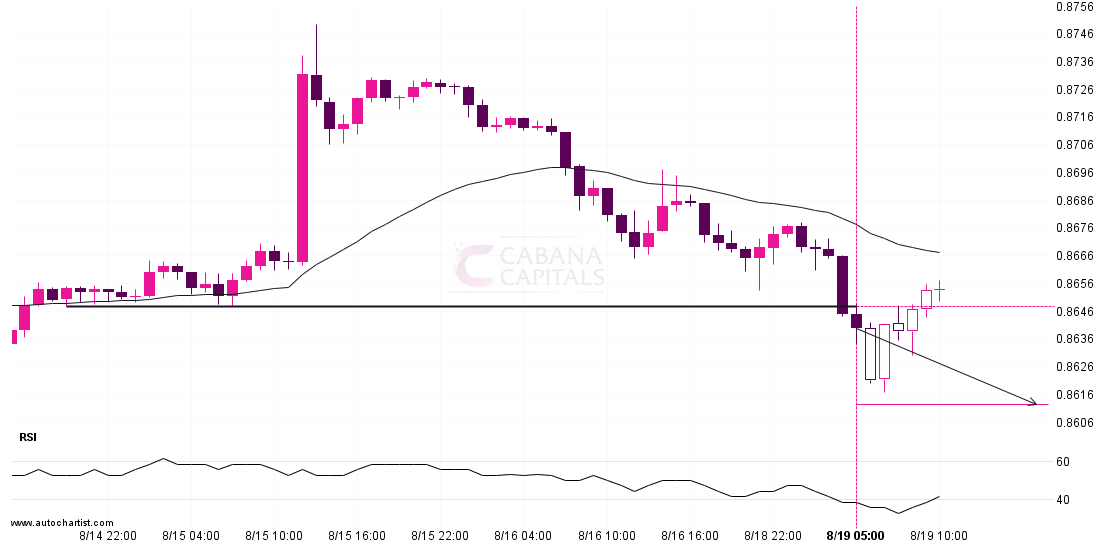
USDCHF has broken through a line of 0.8647 and suggests a possible movement to 0.8612 within the next 7 hours. It has tested this line numerous times in the past,
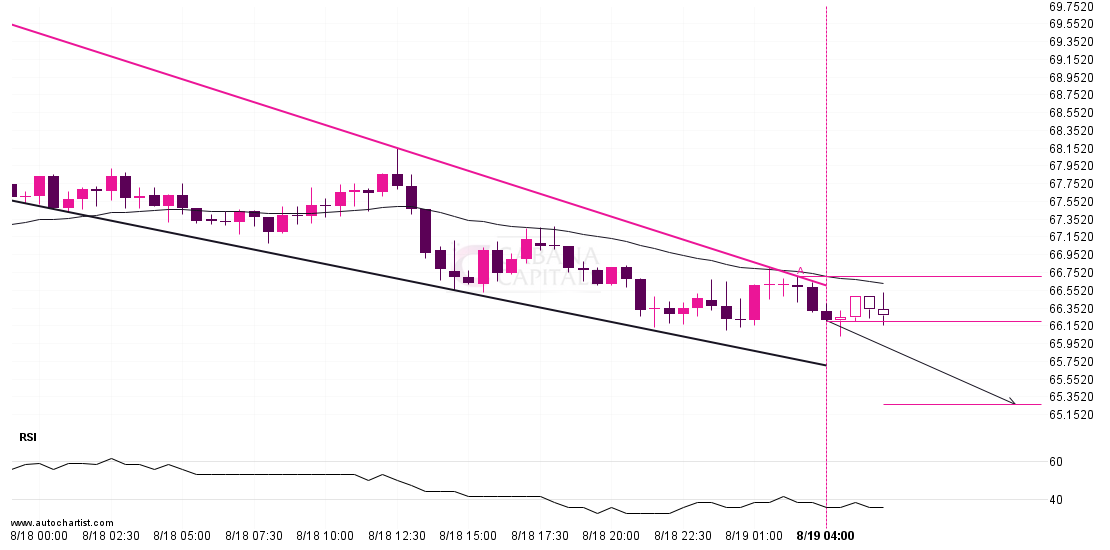
Emerging Falling Wedge detected on LTCUSD – the pattern is an emerging one and has not yet broken through resistance, but the price is expected to move up over the
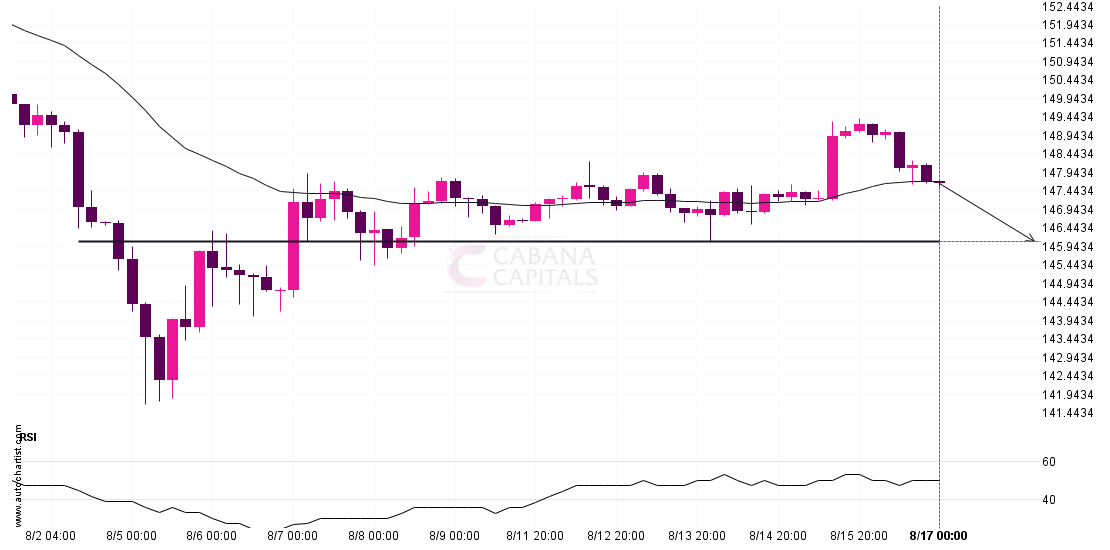
A strong support level has been identified at 146.0710 on the 4 hour USDJPY chart. USDJPY is likely to test it soon. Target: 146.071 Entry: 147.646 Stop: 148.2528
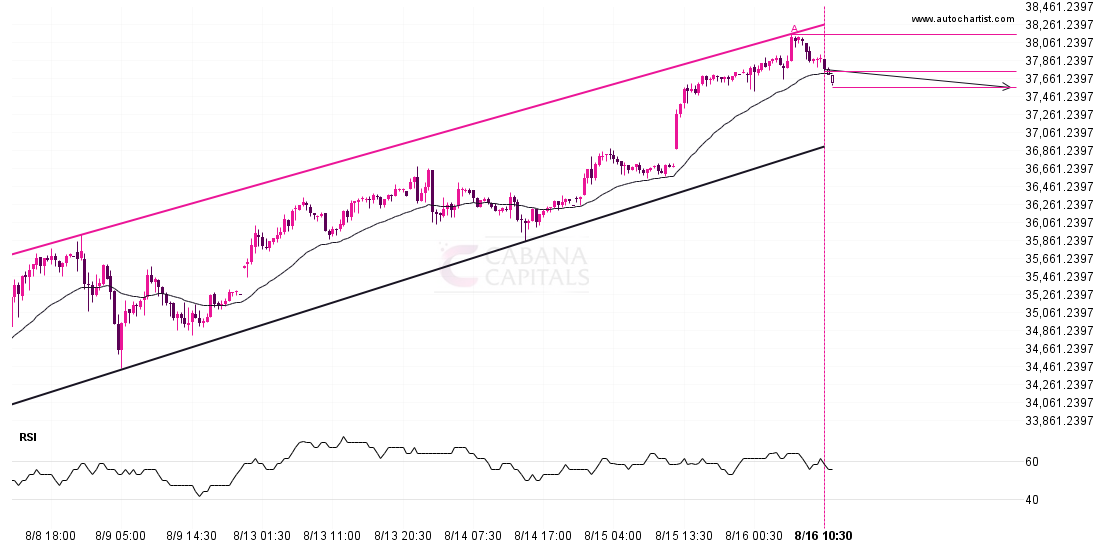
Nikkei 225 is heading towards the support line of a Channel Up. If this movement continues, the price of Nikkei 225 could test 37553.8417 within the next 2 days. It
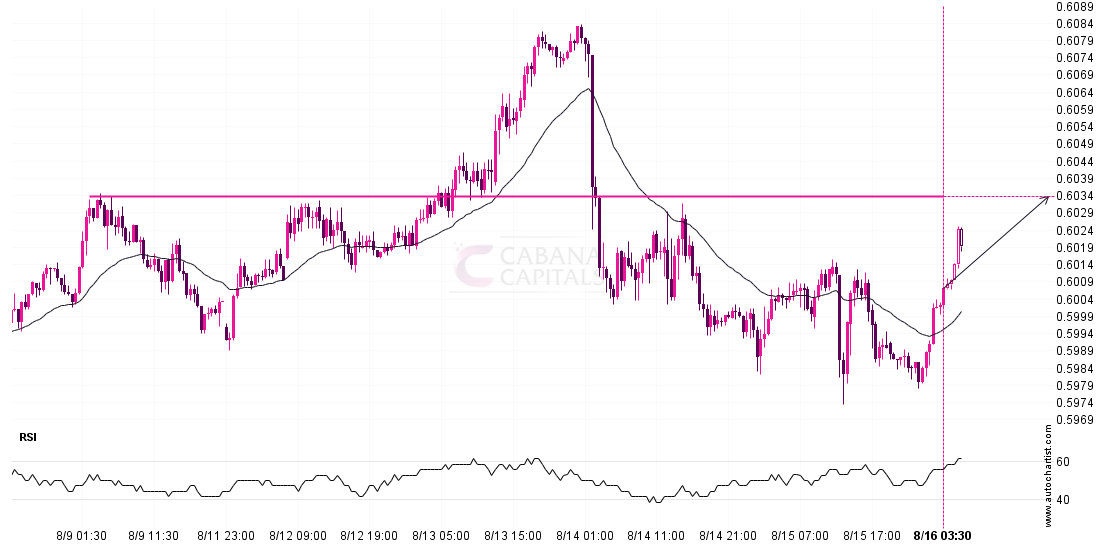
NZDUSD is approaching a resistance line at 0.6034. If it hits the resistance line, it may break through this level to continue the bullish trend, or it may turn around
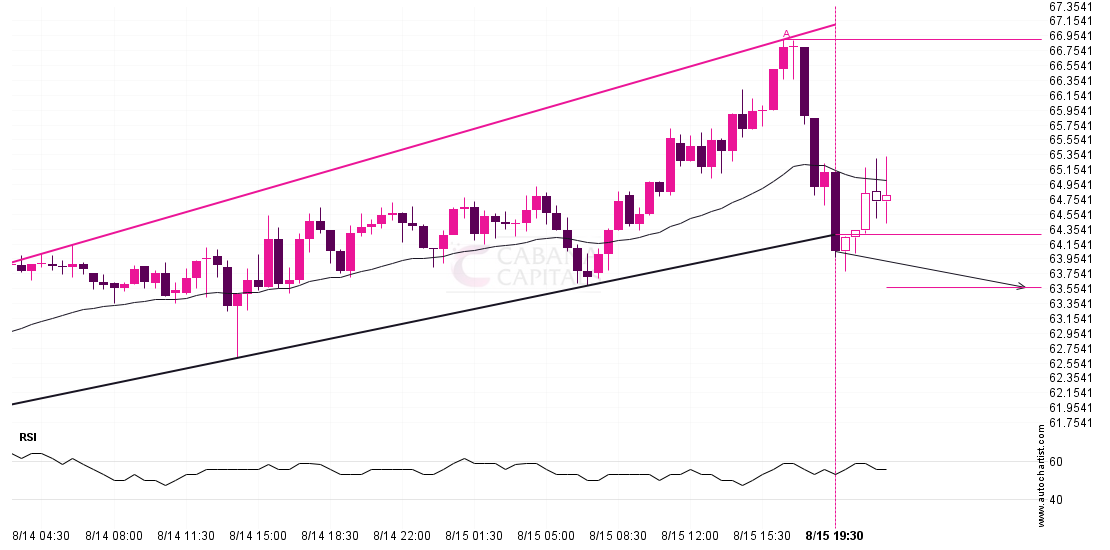
The breakout of LTCUSD through the support line of a Channel Up could be a sign of the road ahead. If this breakout persists, we may see the price of
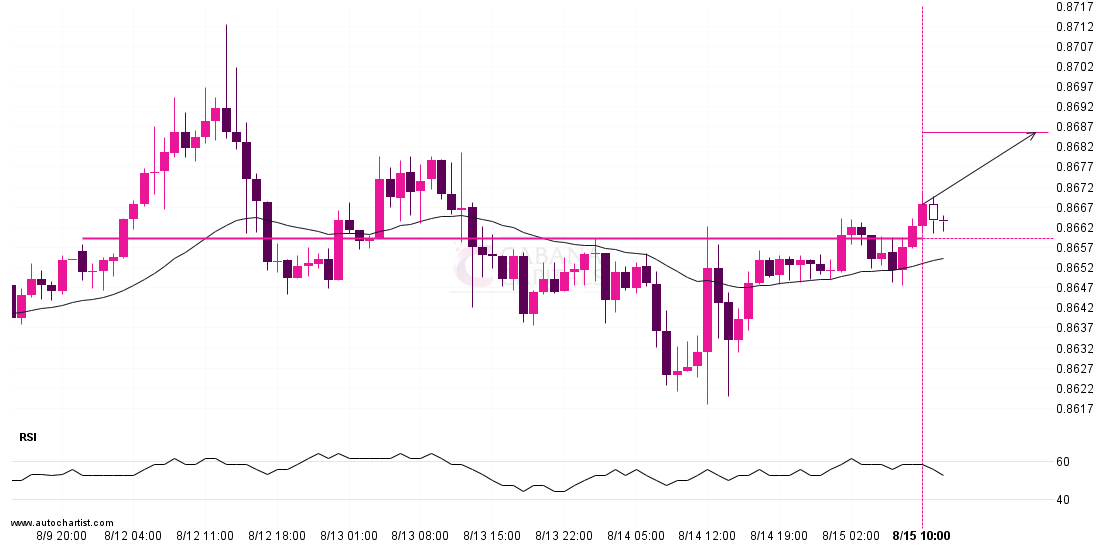
USDCHF is once again retesting a key horizontal resistance level at 0.8659. It has tested this level 3 times in the recent past and could simply bounce off like it

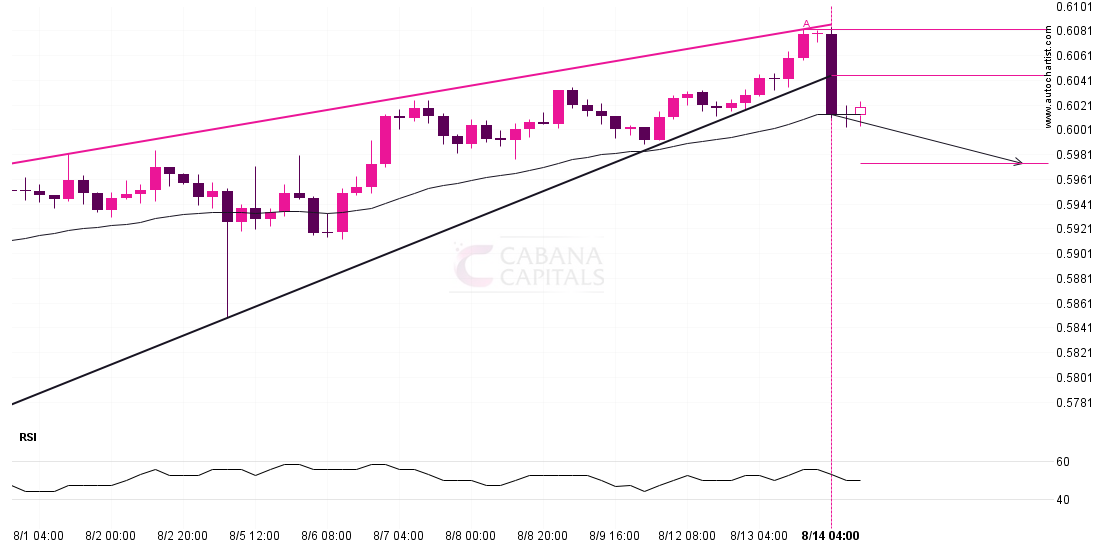
Rising Wedge pattern identified on AUDUSD has broken through a support level with the price momentum continuing to move in an downward direction. A solid trading opportunity continues with the
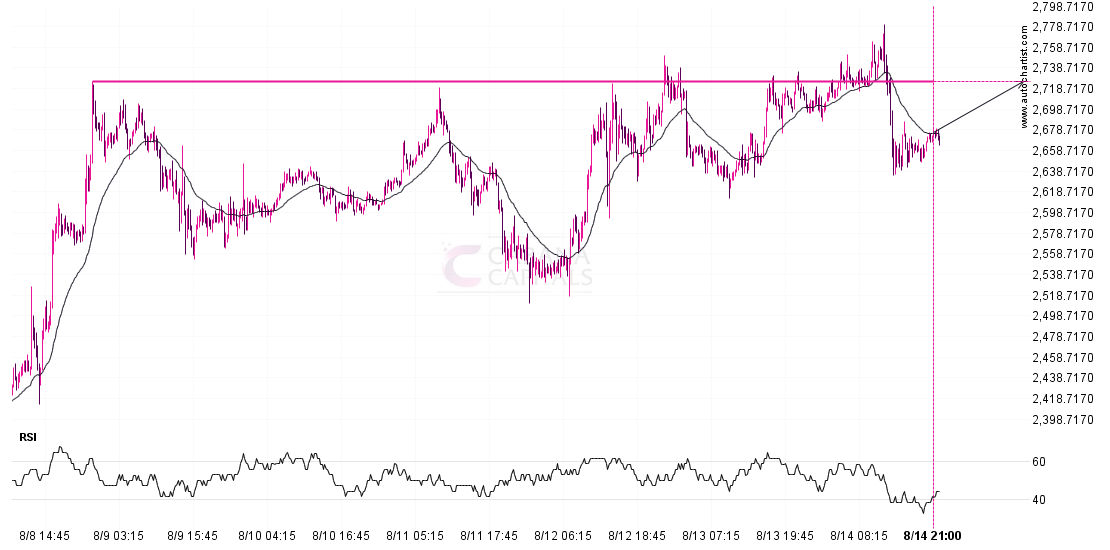
ETHUSD is moving towards a key resistance level at 2725.2700. This is a previously tested level for ETHUSD. This could be a good trading opportunity, either at the spot price,
This trade setup on NZDUSD is formed by a period of consolidation; a period in which the price primarily moves sideways before choosing a new direction for the longer term.