AUDUSD – Reversal Chart Pattern – Channel UpAUDUSD – Reversal Chart Pattern – Channel Up
AUDUSD is moving towards a resistance line which it has tested numerous times in the past. We have seen it retrace from this line before, so at this stage it
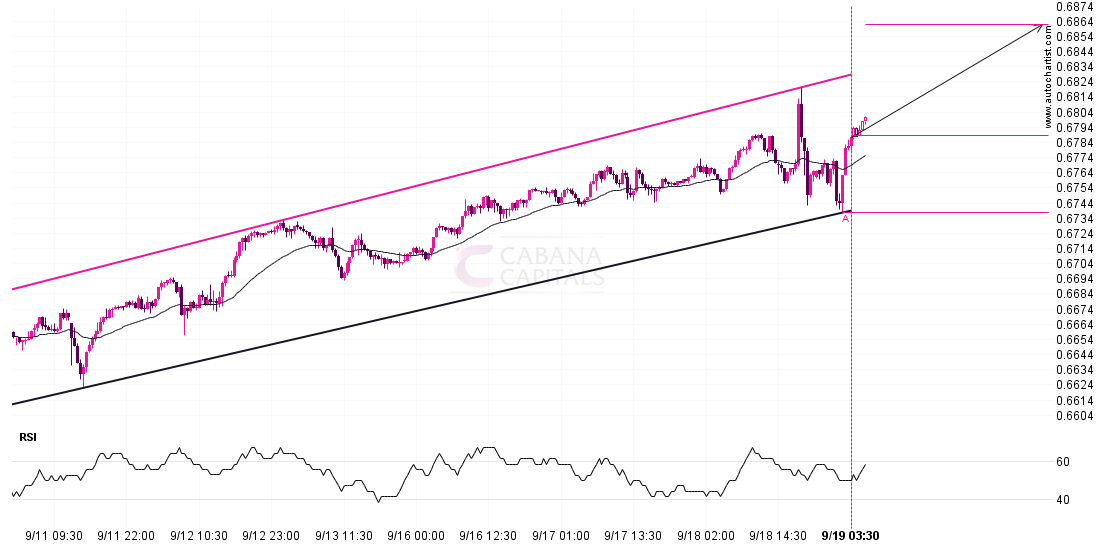
AUDUSD is moving towards a resistance line which it has tested numerous times in the past. We have seen it retrace from this line before, so at this stage it
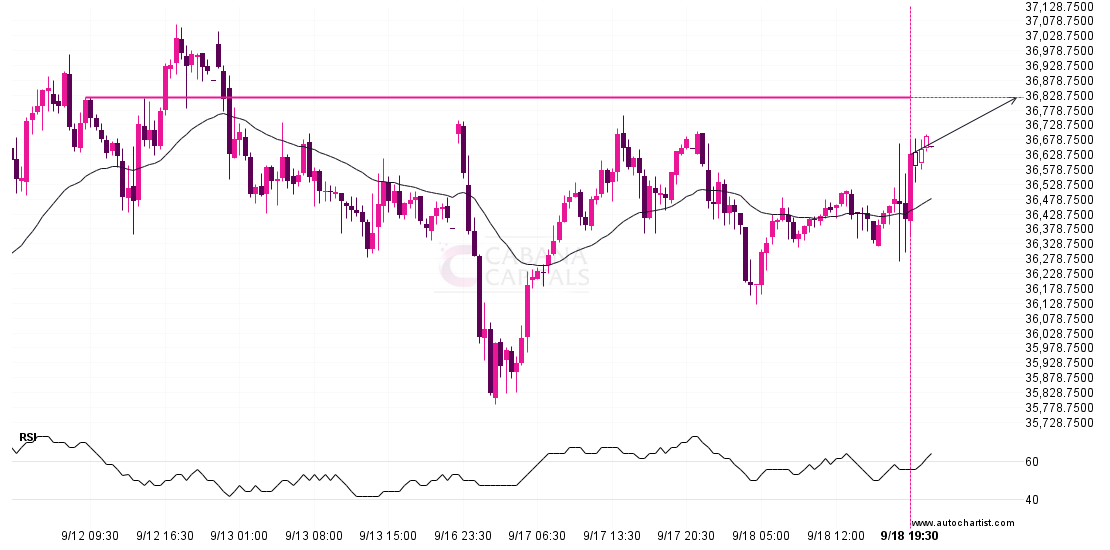
Nikkei 225 is heading towards a line of 36821.0000. If this movement continues, the price of Nikkei 225 could test 36821.0000 within the next 17 hours. But don’t be so
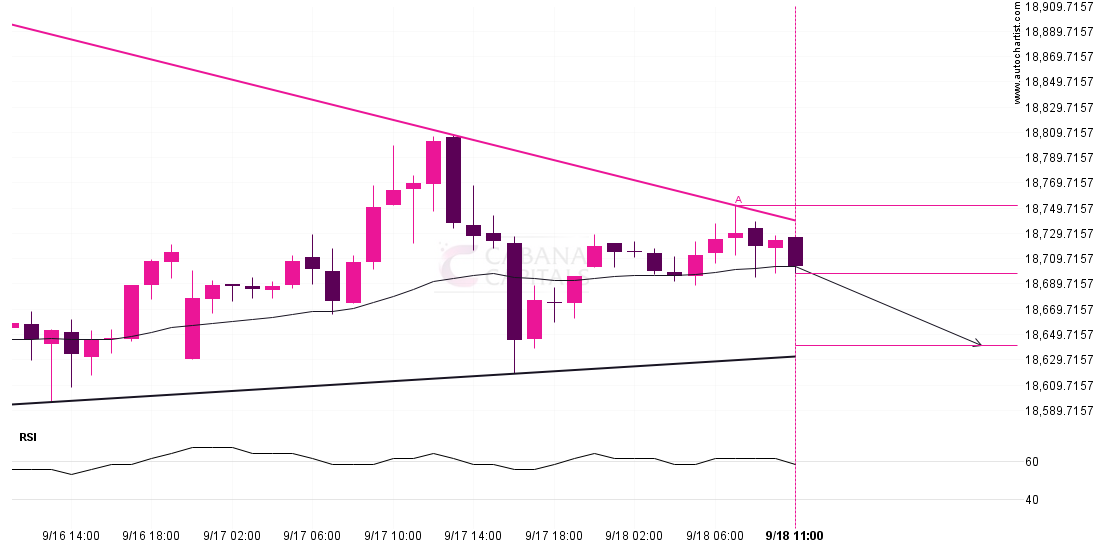
DAX 40 is trapped in a Triangle formation, implying that a breakout is Imminent. This is a great trade-setup for both trend and swing traders. It is now approaching a

USDCHF is moving towards a key support level at 0.8434. USDCHF has previously tested this level 3 times and on each occasion it has bounced back off this level. Is
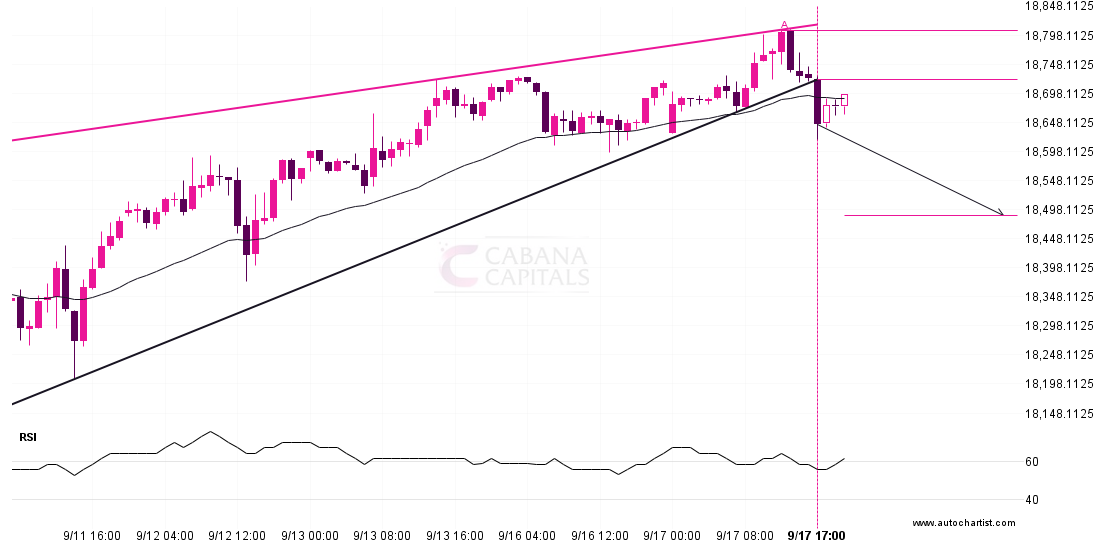
DAX 40 has broken through a support line of a Rising Wedge and suggests a possible movement to 18488.4994 within the next 23 hours. It has tested this line in
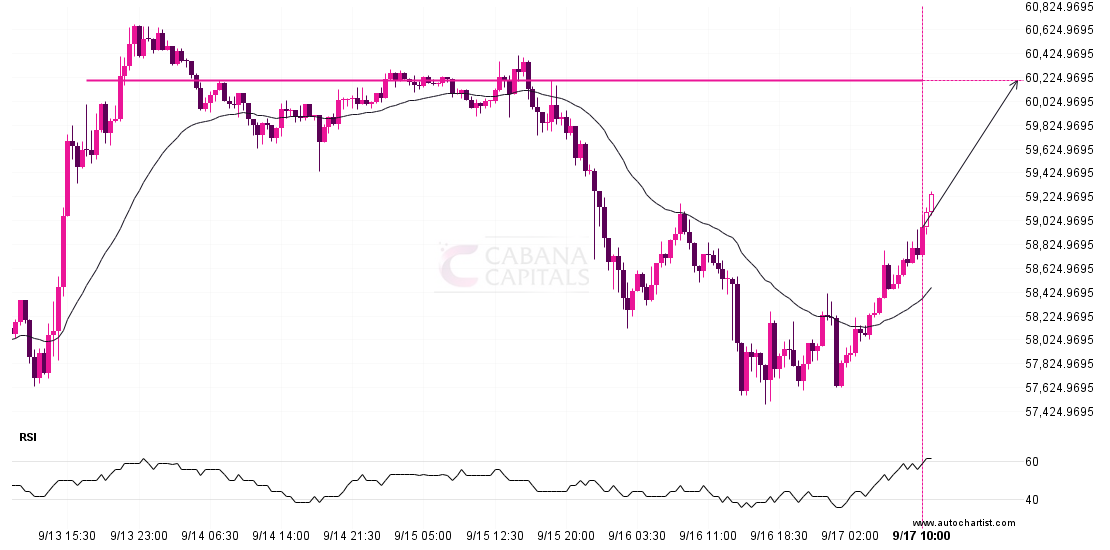
BTCUSD is moving towards a key resistance level at 60198.1211. This is a previously tested level for BTCUSD. This could be a good trading opportunity, either at the spot price,
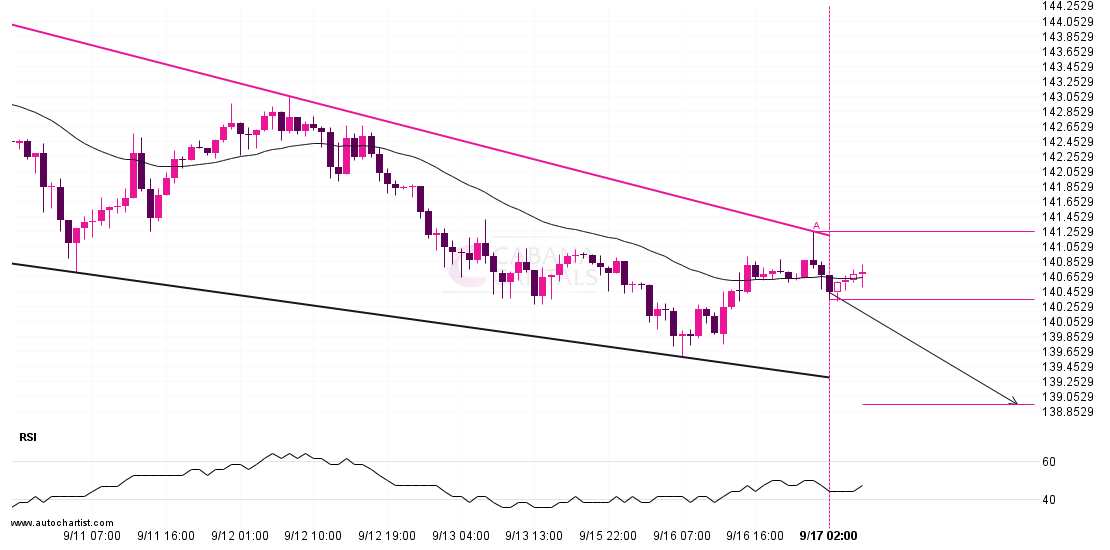
USDJPY is trapped in a Falling Wedge formation, implying that a breakout is Imminent. This is a great trade-setup for both trend and swing traders. It is now approaching a
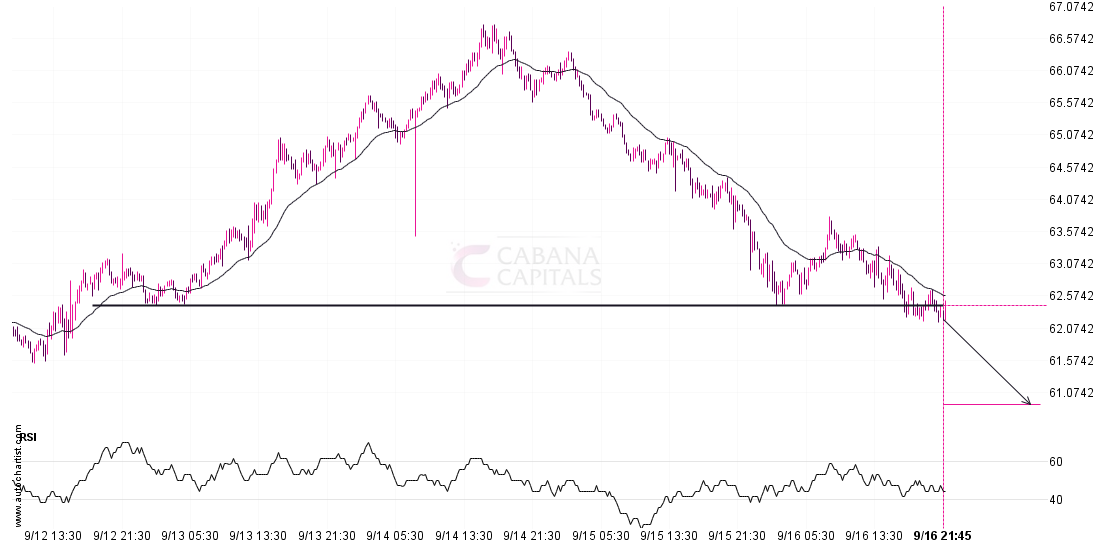
LTCUSD has broken through a support line. It has touched this line numerous times in the last 5 days. This breakout shows a potential move to 60.8950 within the next
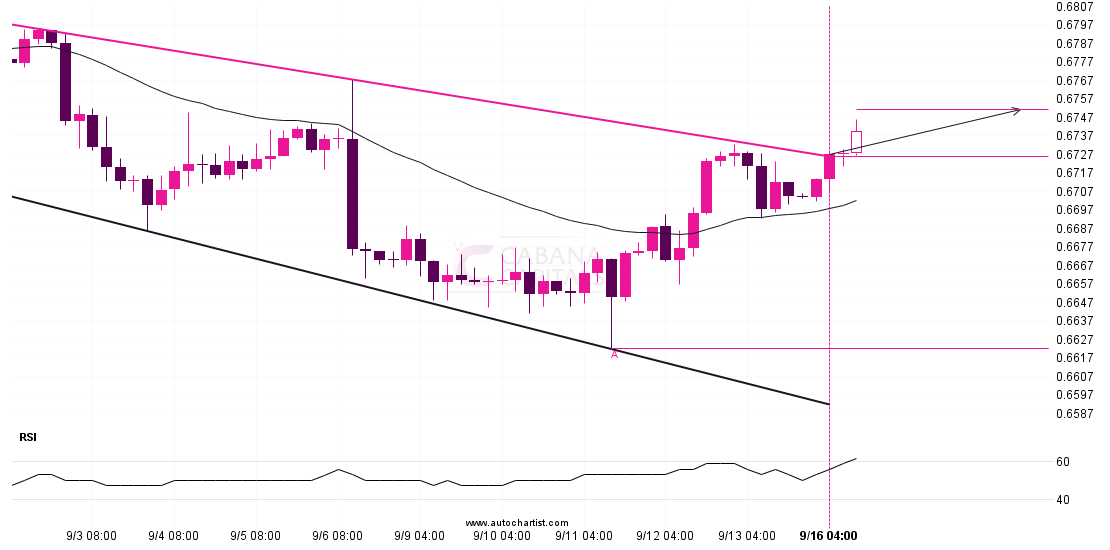
AUDUSD moved through the resistance line of a Channel Down at 0.6726166666666665 on the 4 hour chart. This line has been tested a number of times in the past and
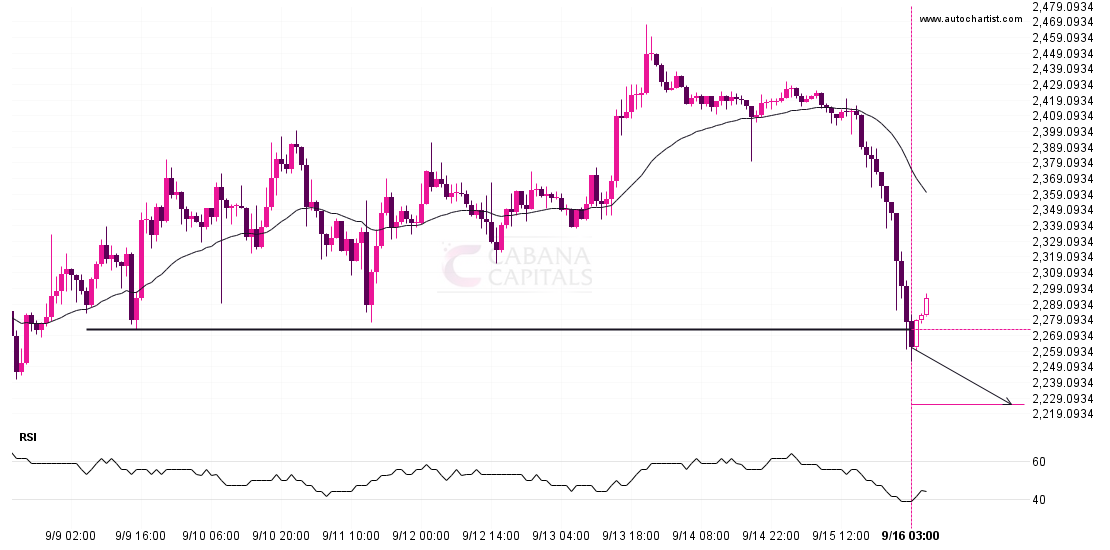
ETHUSD has broken through a line of 2272.9600 and suggests a possible movement to 2225.3420 within the next 2 days. It has tested this line numerous times in the past,