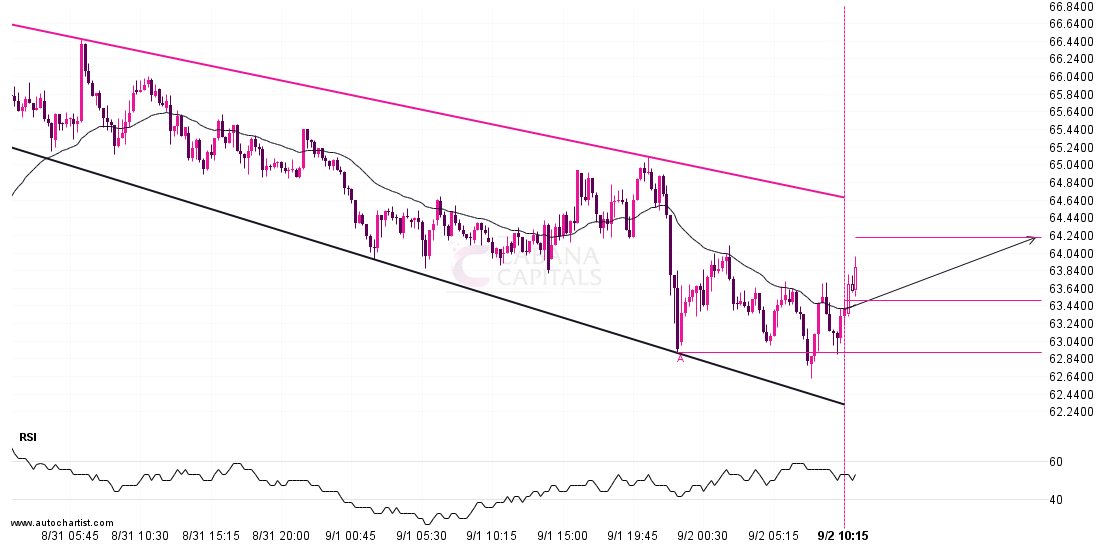
An emerging Channel Down has been detected on LTCUSD on the 15 Minutes chart. There is a possible move towards 64.2216 next few candles. Once reaching support it may continue its bullish run or reverse back to current price levels.
Supported by Upward sloping Moving Average
Target: 64.2216 Entry: 63.5 Stop: 62.91