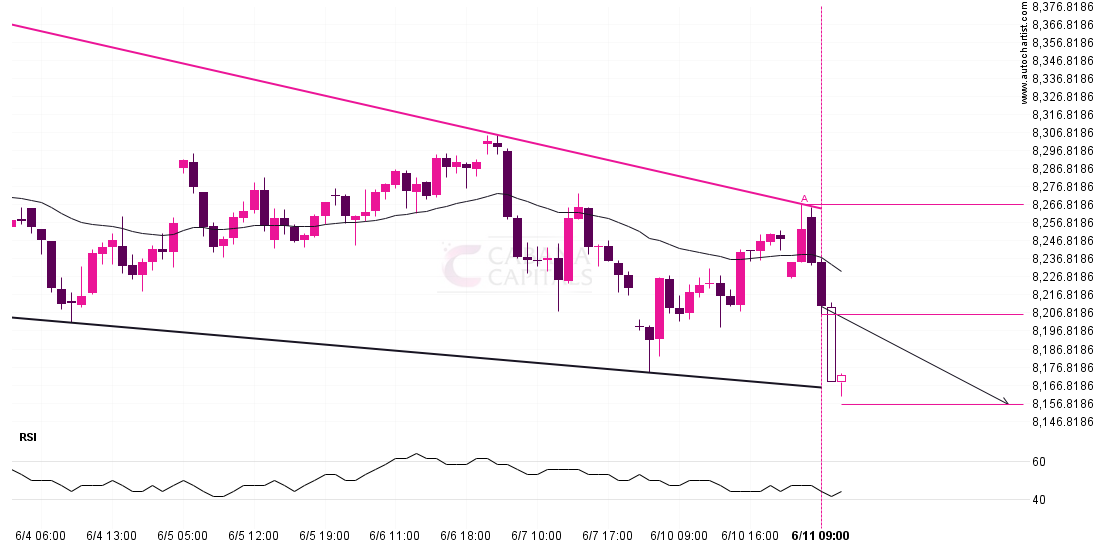
FTSE 100 is moving towards a support line which it has tested numerous times in the past. We have seen it retrace from this line before, so at this stage it isn’t clear whether it will breach this line or rebound as it did before. If FTSE 100 continues in its current trajectory, we could see it reach 8156.3482 within the next 21 hours.
Supported by Downward sloping Moving Average
Target: 8156.3482 Entry: 8205.9 Stop: 8267


