FTSE 100 approaches important level of 8299.0996FTSE 100 approaches important level of 8299.0996
FTSE 100 is en route to a very important line that will be a definite deciding factor of what is to come! We may see this trajectory continue to touch
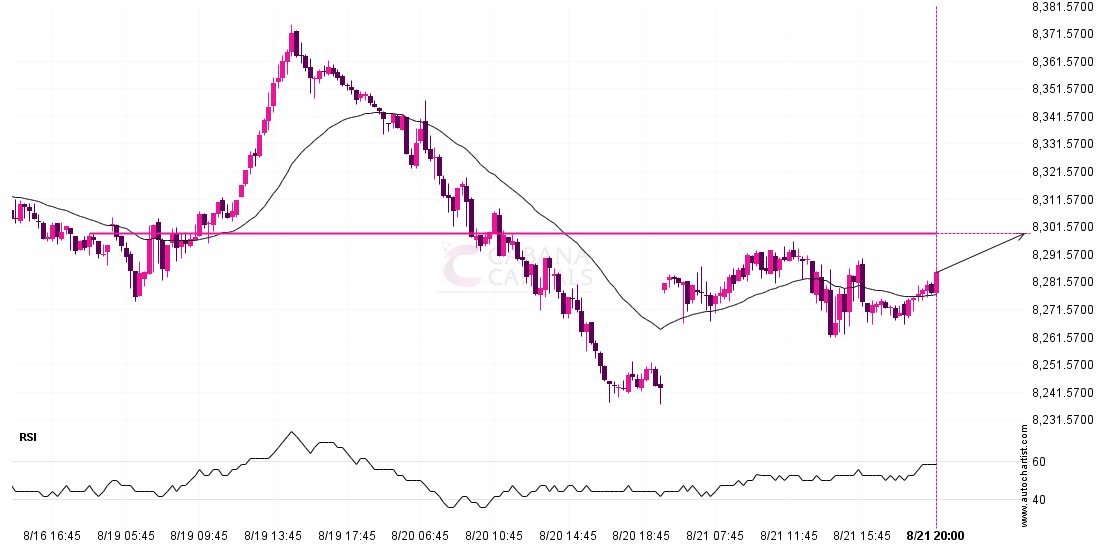
FTSE 100 is en route to a very important line that will be a definite deciding factor of what is to come! We may see this trajectory continue to touch
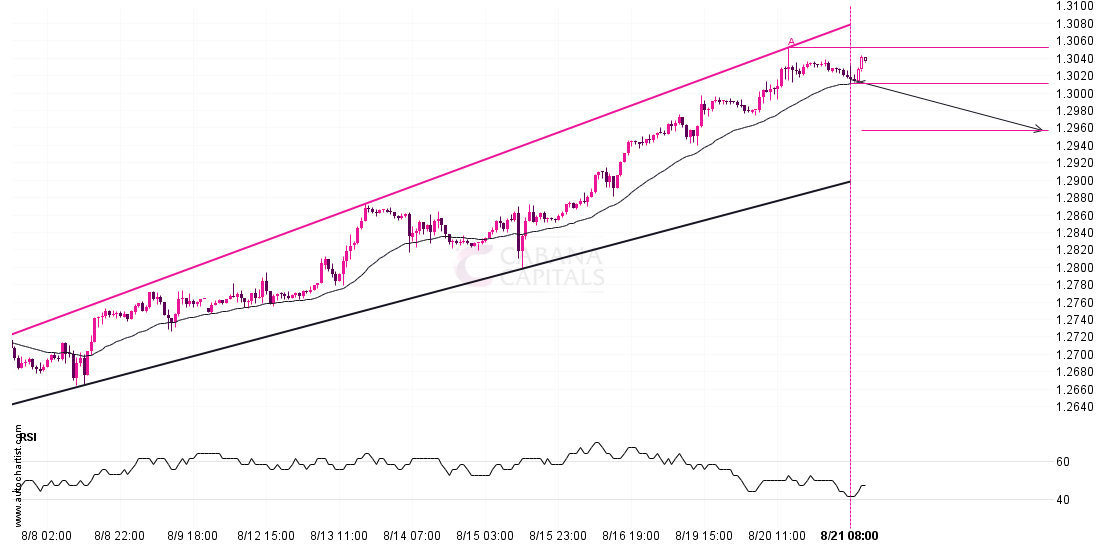
A Channel Up pattern was identified on GBPUSD at 1.3011, creating an expectation that it may move to the support line at 1.2957. It may break through that line and
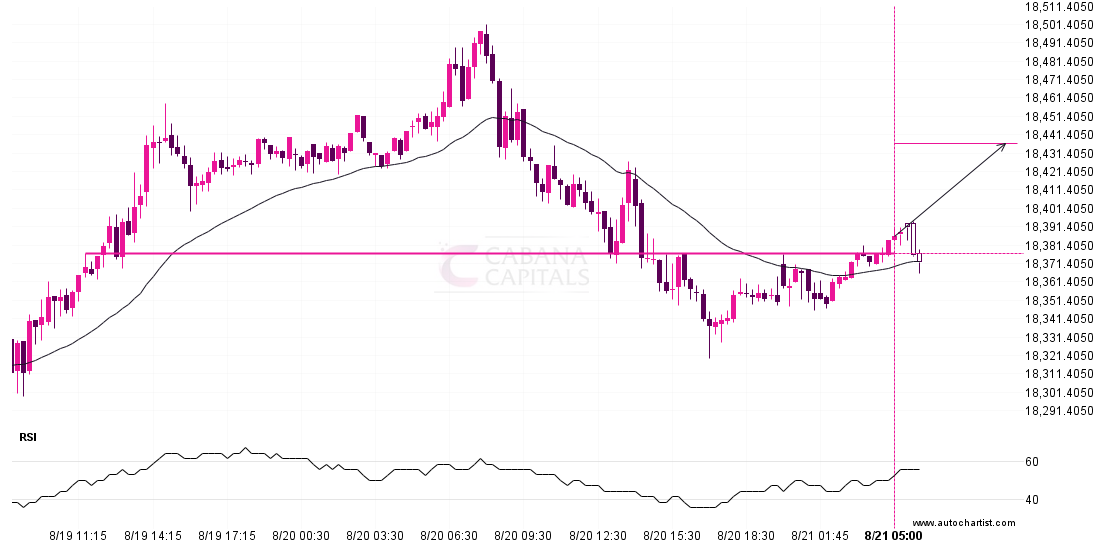
DAX 40 has broken through a resistance line. It has touched this line numerous times in the last 2 days. This breakout shows a potential move to 18436.6992 within the
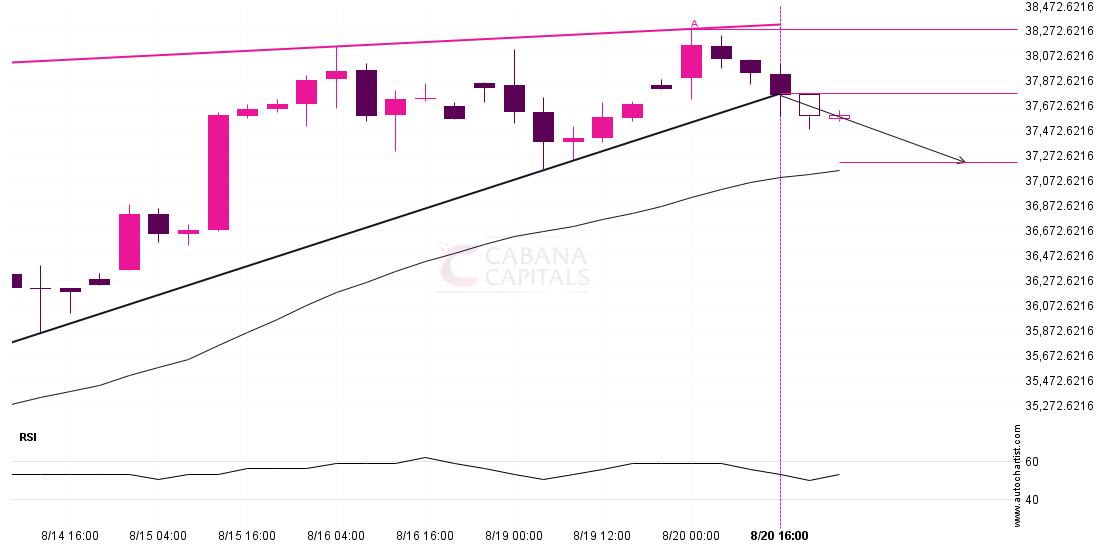
Nikkei 225 has broken through a support line of a Rising Wedge chart pattern. If this breakout holds true, we may see the price of Nikkei 225 testing 37214.8344 within
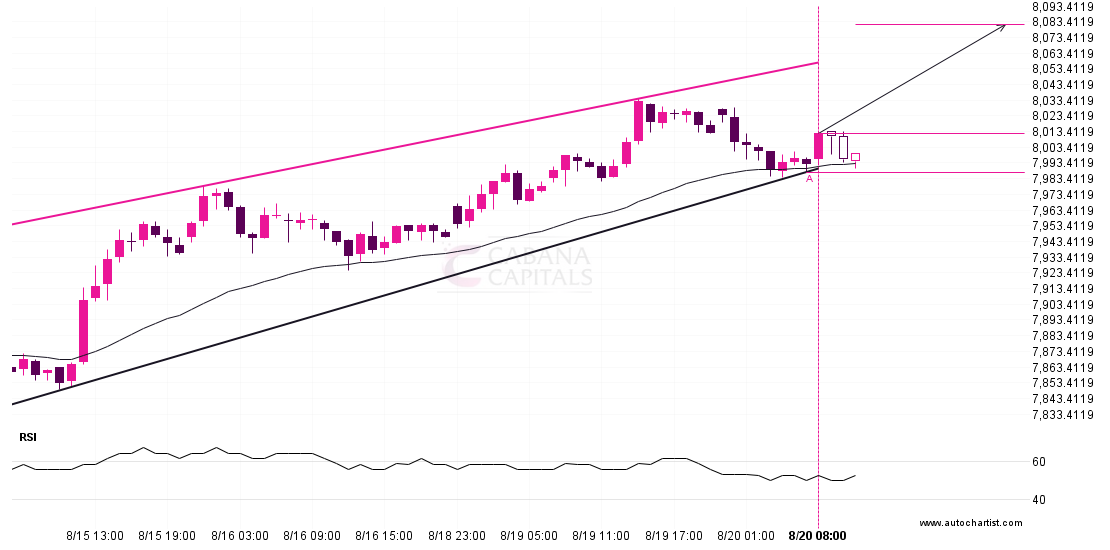
ASX 225 was identified at around 8012.4 having recently rebounded of the support on the 1 hour data interval. Ultimately, the price action of the stock has formed a Channel
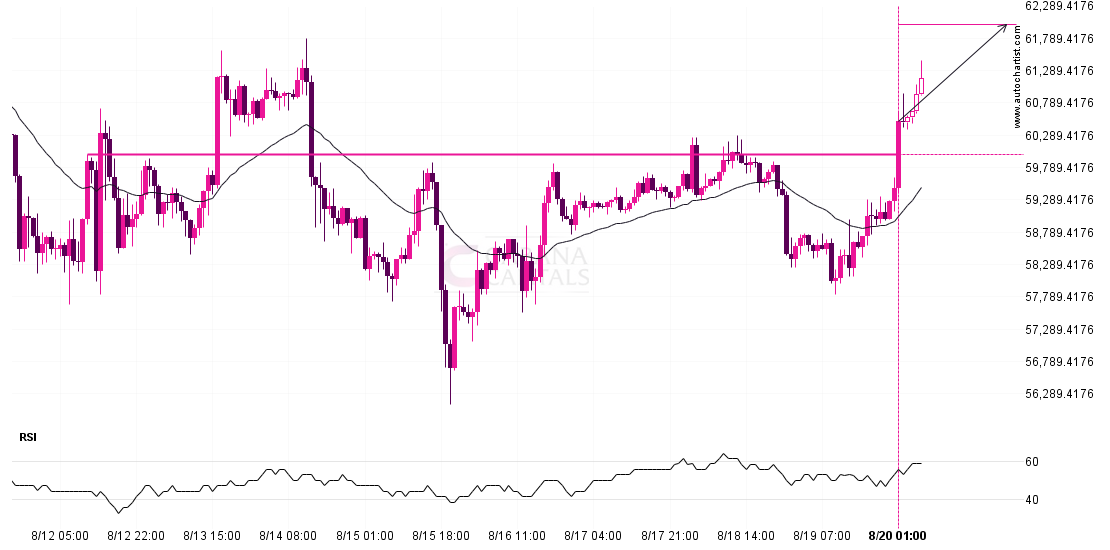
BTCUSD has breached the resistance line at 59992.1992. It may continue the bullish trend towards 61996.2539, or, it may prove to be yet another test of this level. Supported by
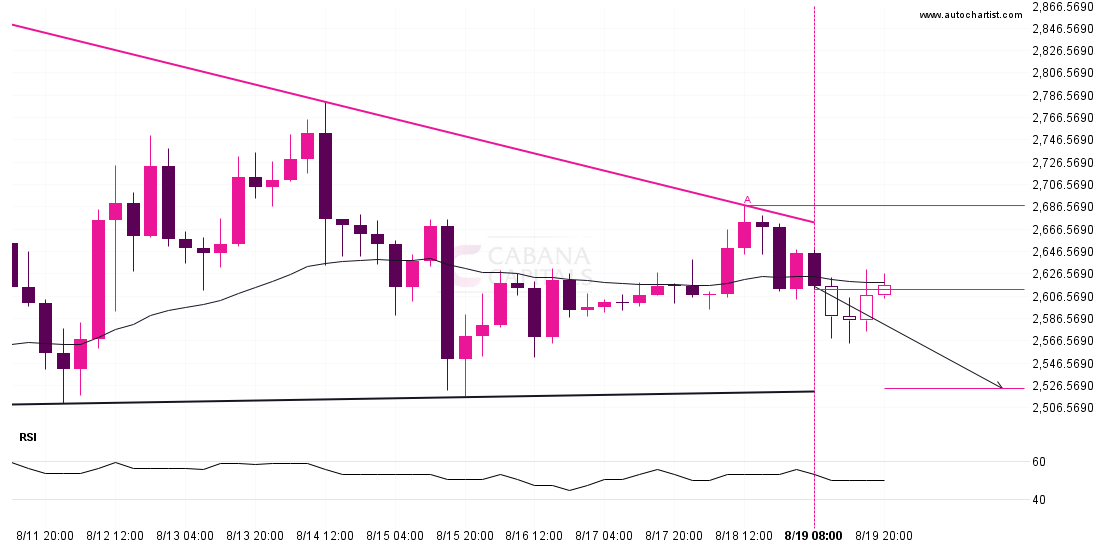
A Descending Triangle pattern was identified on ETHUSD at 2612.72, creating an expectation that it may move to the support line at 2524.0038. It may break through that line and
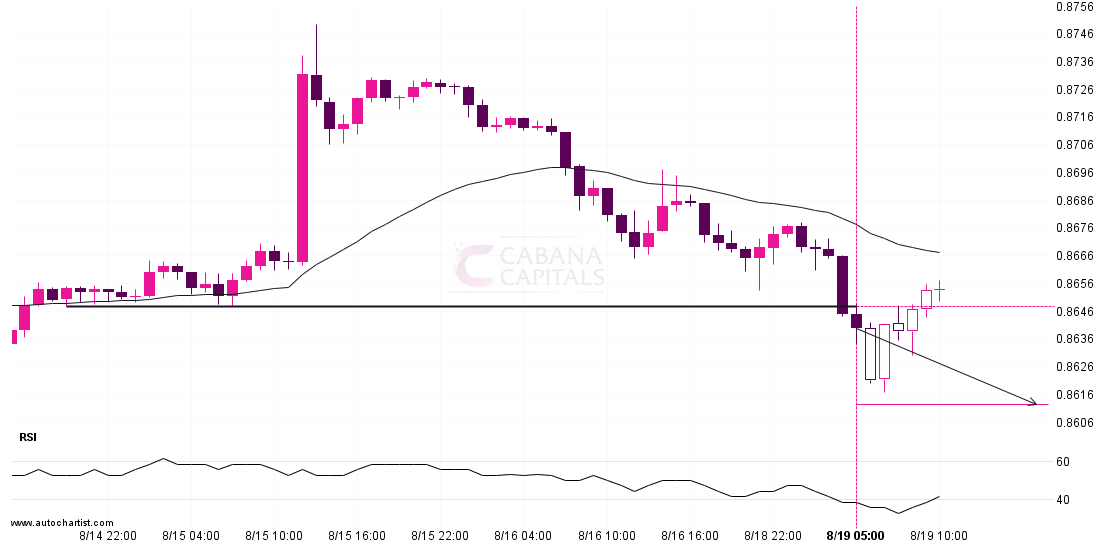
USDCHF has broken through a line of 0.8647 and suggests a possible movement to 0.8612 within the next 7 hours. It has tested this line numerous times in the past,
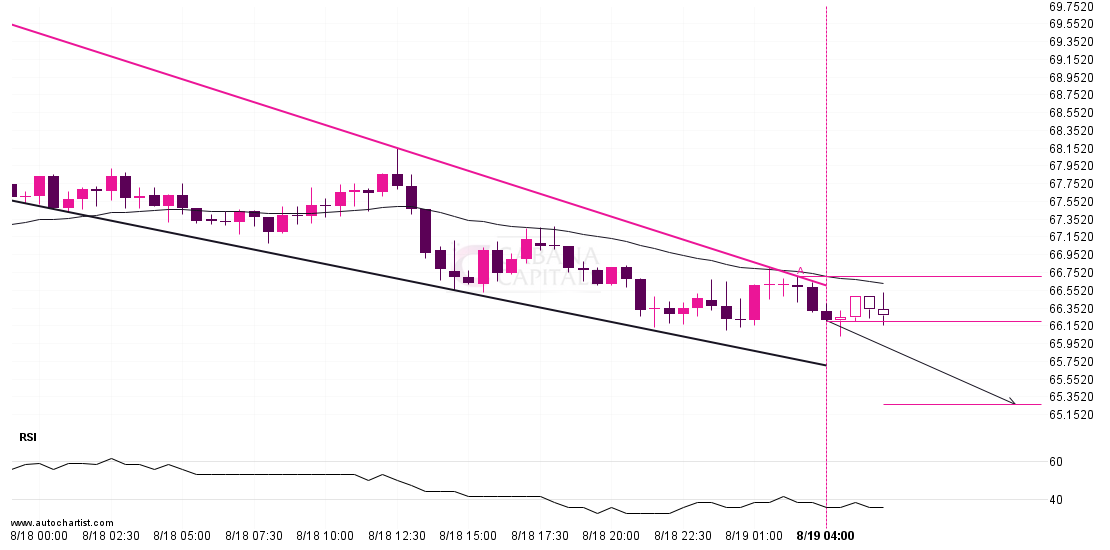
Emerging Falling Wedge detected on LTCUSD – the pattern is an emerging one and has not yet broken through resistance, but the price is expected to move up over the
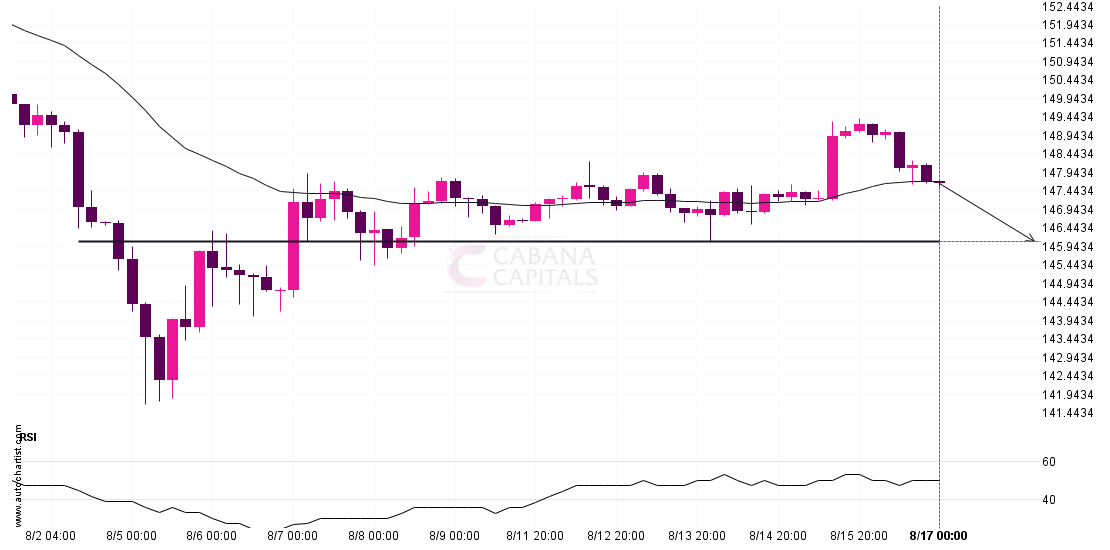
A strong support level has been identified at 146.0710 on the 4 hour USDJPY chart. USDJPY is likely to test it soon. Target: 146.071 Entry: 147.646 Stop: 148.2528