A possible start of a bearish trend on LTCUSDA possible start of a bearish trend on LTCUSD
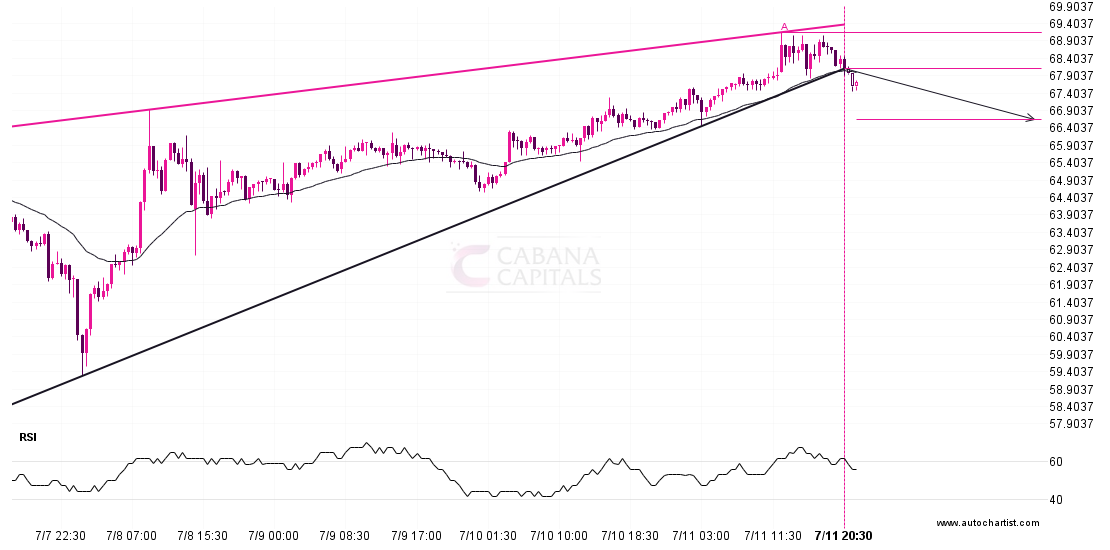
LTCUSD has broken through a support line of a Rising Wedge and suggests a possible movement to 66.6559 within the next 2 days. It has tested this line in the

LTCUSD has broken through a support line of a Rising Wedge and suggests a possible movement to 66.6559 within the next 2 days. It has tested this line in the

Overview:–By looking at the daily chart we can see that buyers are showing their potential in the market. The market is showing upside momentum in the market. From the technical

The movement of ETHUSD towards 3168.1699 price line is yet another test of the line it reached numerous times in the past. We could expect this test to happen in

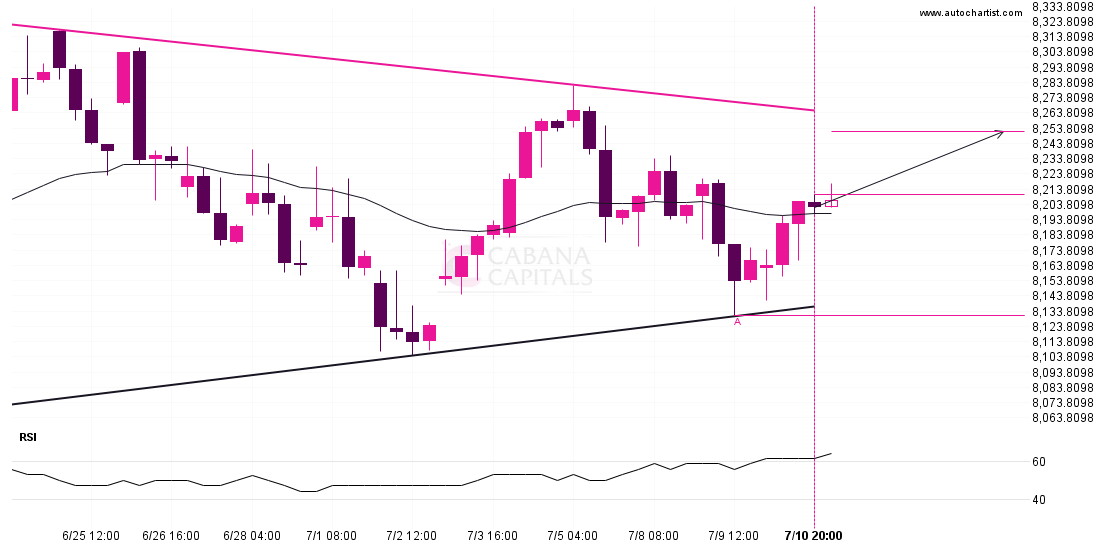
FTSE 100 is approaching the resistance line of a Triangle. It has touched this line numerous times in the last 20 days. If it tests this line again, it should