Important price line breached by LTCUSDImportant price line breached by LTCUSD
LTCUSD has broken through a support line. Because we have seen it retrace from this price in the past, one should wait for confirmation of the breakout before trading. It
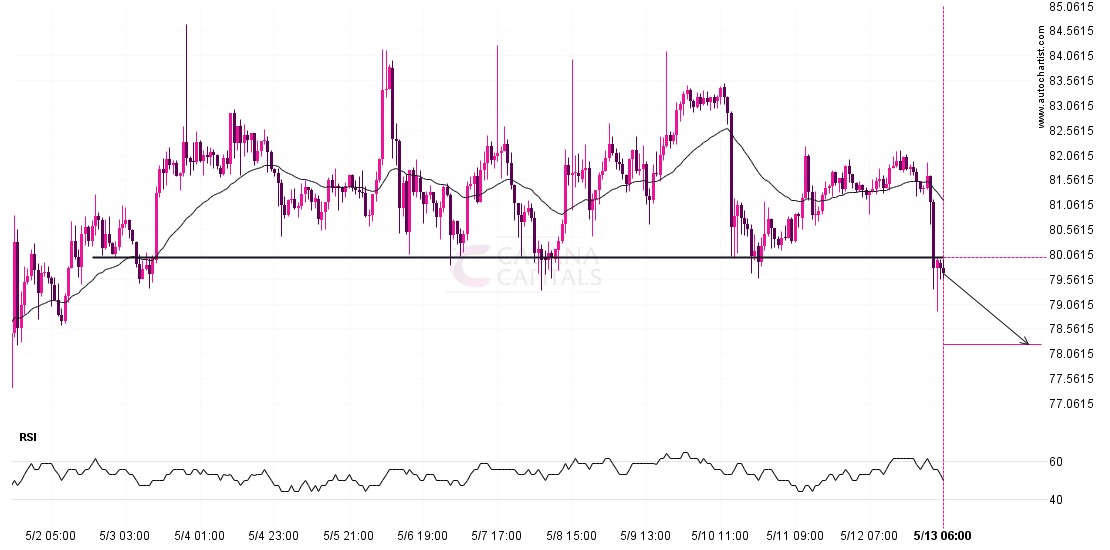
LTCUSD has broken through a support line. Because we have seen it retrace from this price in the past, one should wait for confirmation of the breakout before trading. It
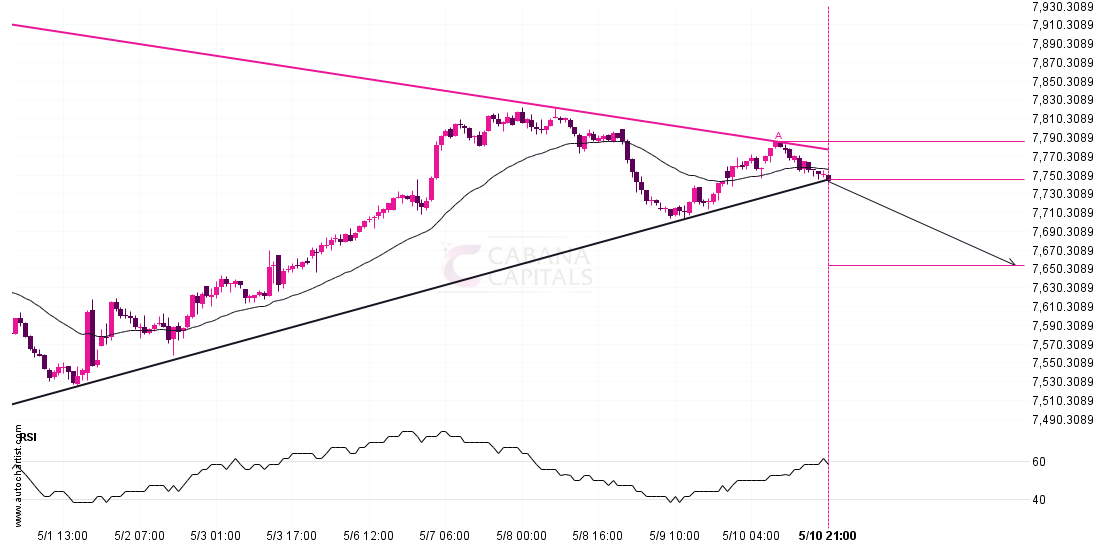
ASX 225 moved through the support line of a Triangle at 7746.047244094489 on the 1 hour chart. This line has been tested a number of times in the past and
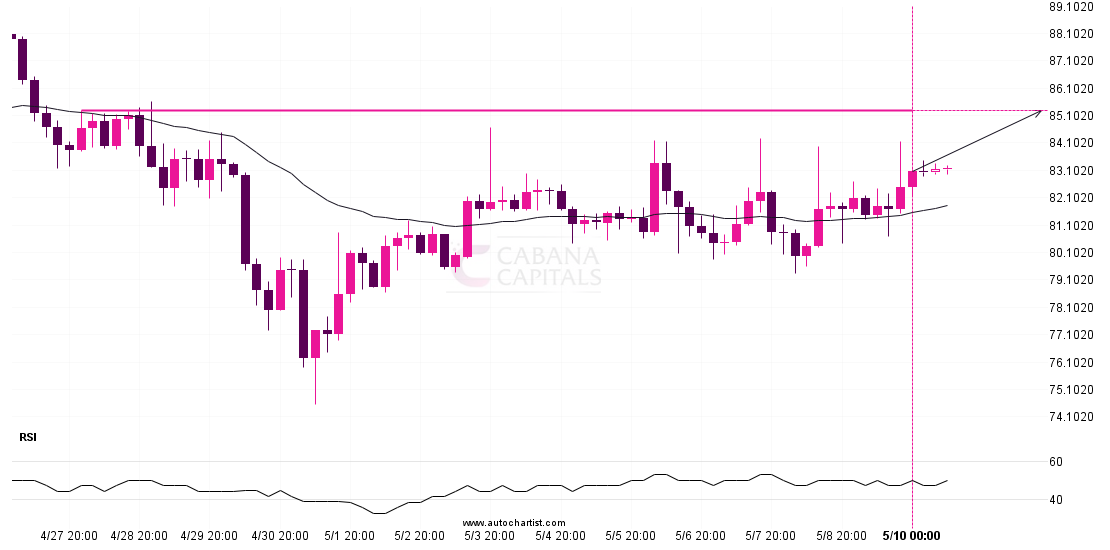
The price of LTCUSD in heading back to the resistance area. It is possible that it will struggle to break through it and move back in the other direction. The

Overview:–By looking at the daily chart we can see that buyers are showing their potential in the market. The market is showing upside momentum in the market. From the technical

Nikkei 225 is heading towards the resistance line of a Channel Up and could reach this point within the next 2 days. It has tested this line numerous times in

USDJPY is moving towards a key support level at 155.0200. This is a previously tested level for USDJPY. This could be a good trading opportunity, either at the spot price,
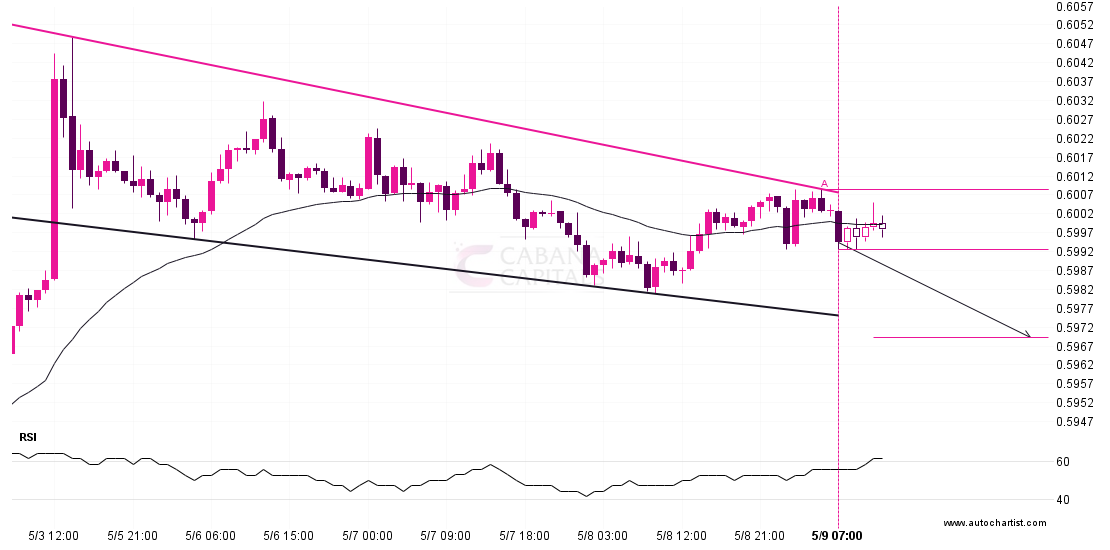
NZDUSD was identified at around 0.59927 having recently rebounded of the resistance on the 1 hour data interval. Ultimately, the price action of the stock has formed a Falling Wedge

Overview:- By analyzing at the daily chart we can see that pair is making successively lower lows and lower highs where only bears are showing their full strength and they
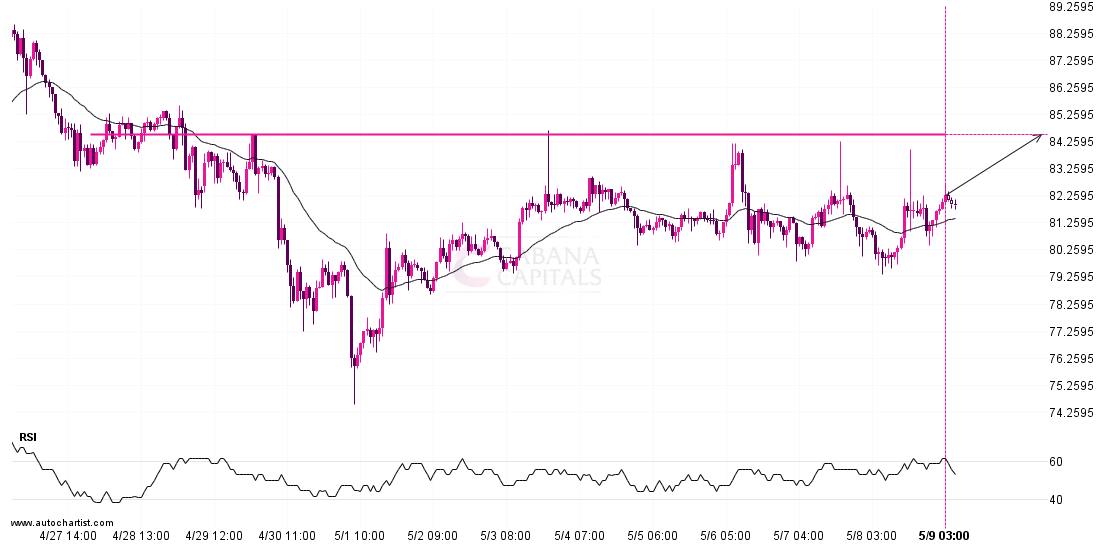
LTCUSD is approaching a resistance line at 84.5000. If it hits the resistance line, it may break through this level to continue the bullish trend, or it may turn around

DOW 30 is moving towards a resistance line which it has tested numerous times in the past. We have seen it retrace from this line before, so at this stage