Possible breach of support level by Nikkei 225Possible breach of support level by Nikkei 225
The movement of Nikkei 225 towards the support line of a Channel Up is yet another test of the line it reached numerous times in the past. This line test
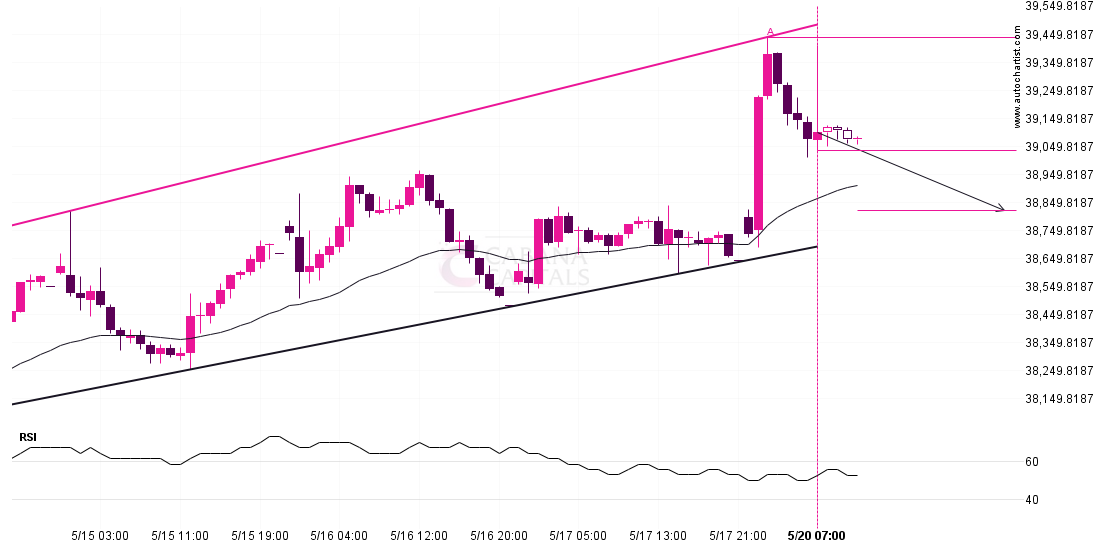
The movement of Nikkei 225 towards the support line of a Channel Up is yet another test of the line it reached numerous times in the past. This line test
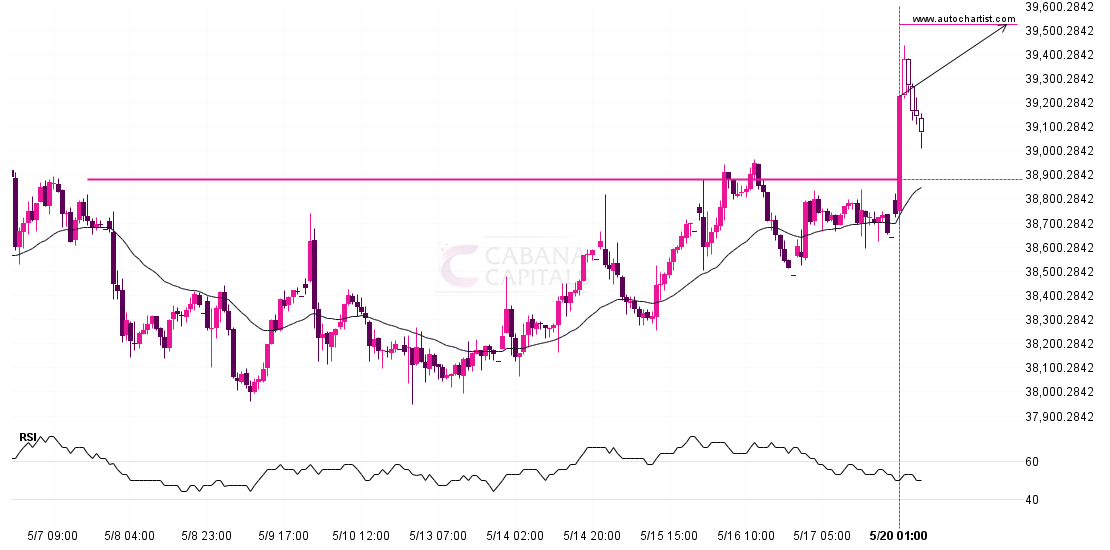
Nikkei 225 has broken through a line of 38882.0000. If this breakout holds true, we could see the price of Nikkei 225 heading towards 39521.6992 within the next 2 days.
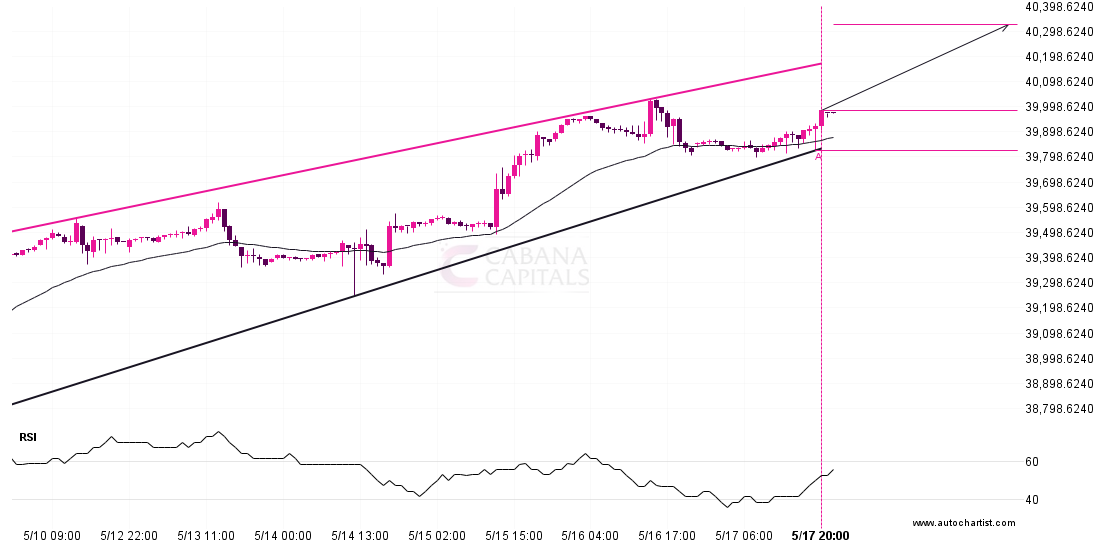
An emerging Rising Wedge has been detected on DOW 30 on the 1 hour chart. There is a possible move towards 40323.2941 next few candles. Once reaching support it may
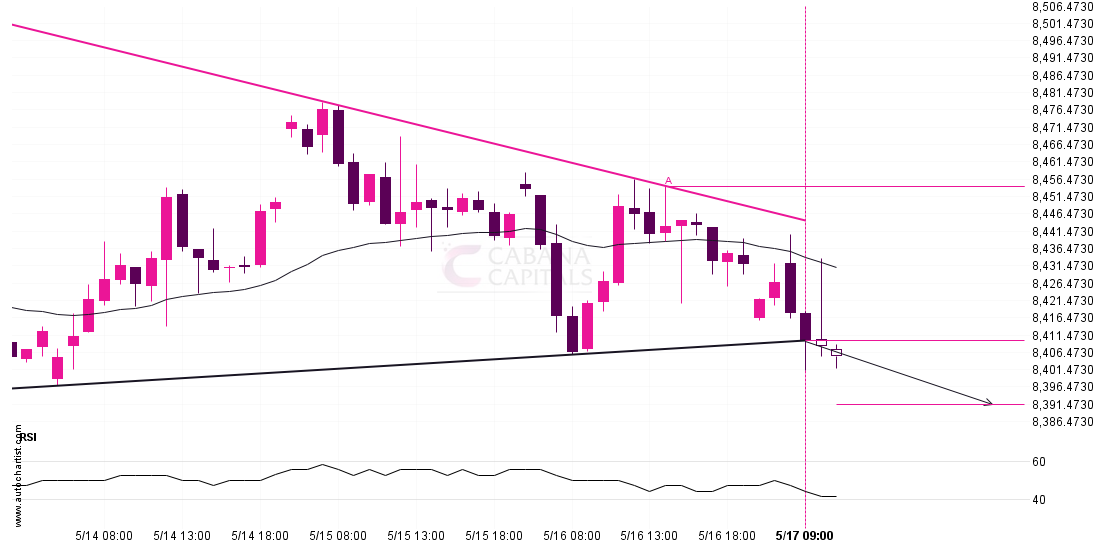
FTSE 100 has broken through the support line which it has tested twice in the past. We have seen it retrace from this line before, so one should wait for
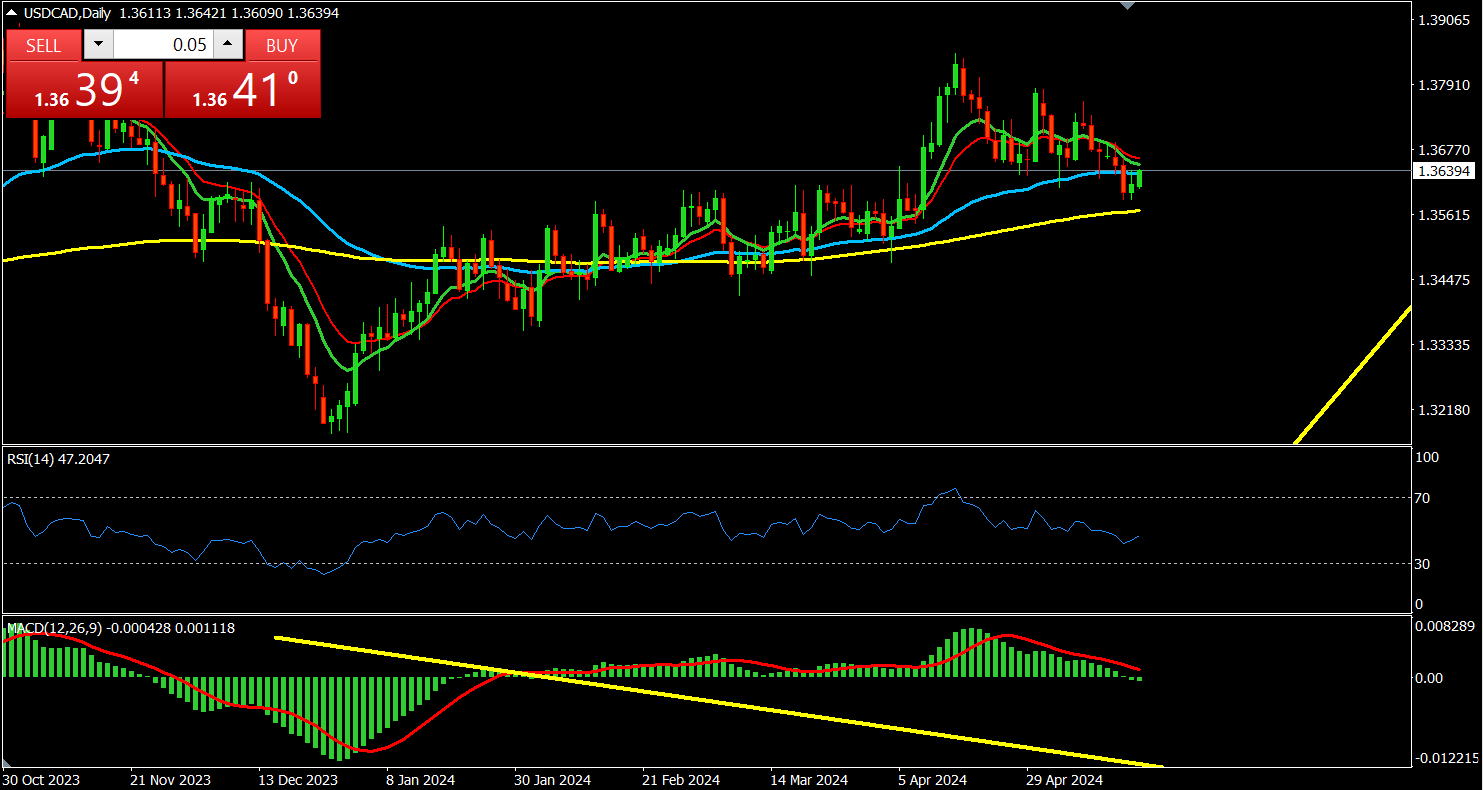
Overview: – By looking at the daily technical chart we can see that earlier pair was heading south side with full of bearish momentum and breaking all the major and
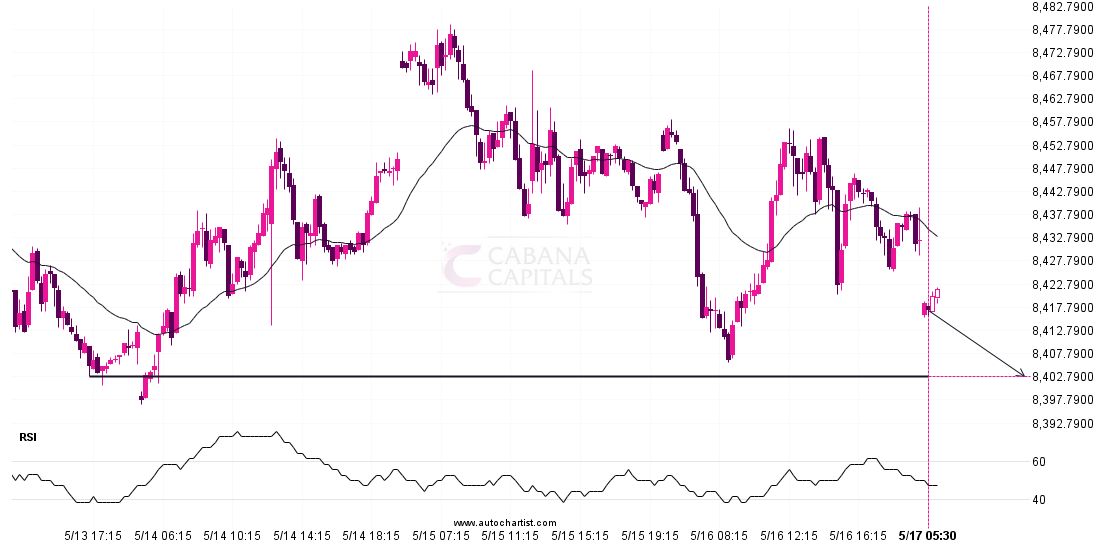
FTSE 100 is en route to a very important line that will be a definite deciding factor of what is to come! We may see this trajectory continue to touch
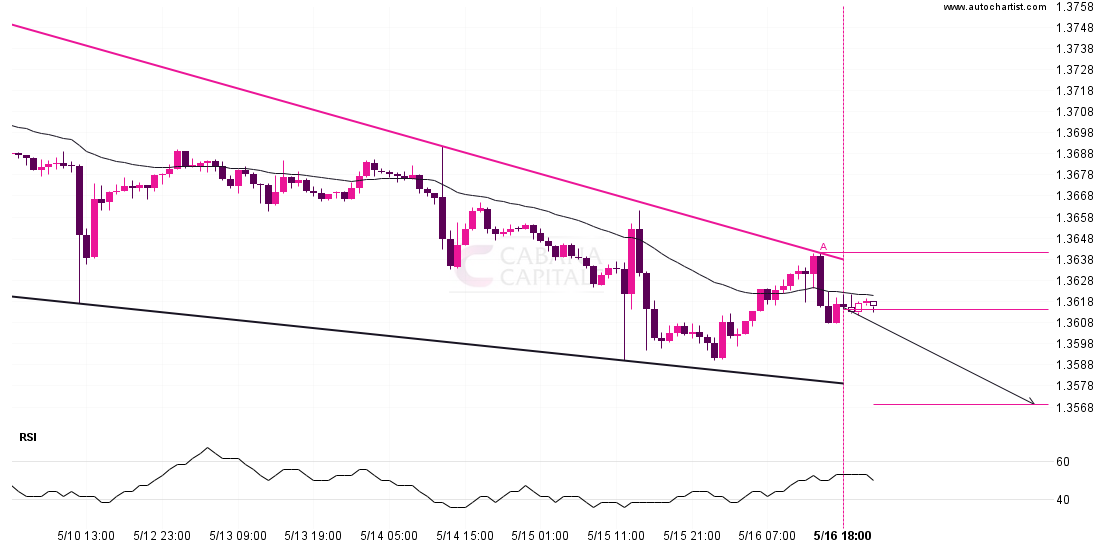
USDCAD is heading towards the support line of a Falling Wedge and could reach this point within the next 2 days. It has tested this line numerous times in the

Overview:- By analyzing at the daily chart we can see that pair is making successively lower lows and lower highs where only bears are showing their full strength and they
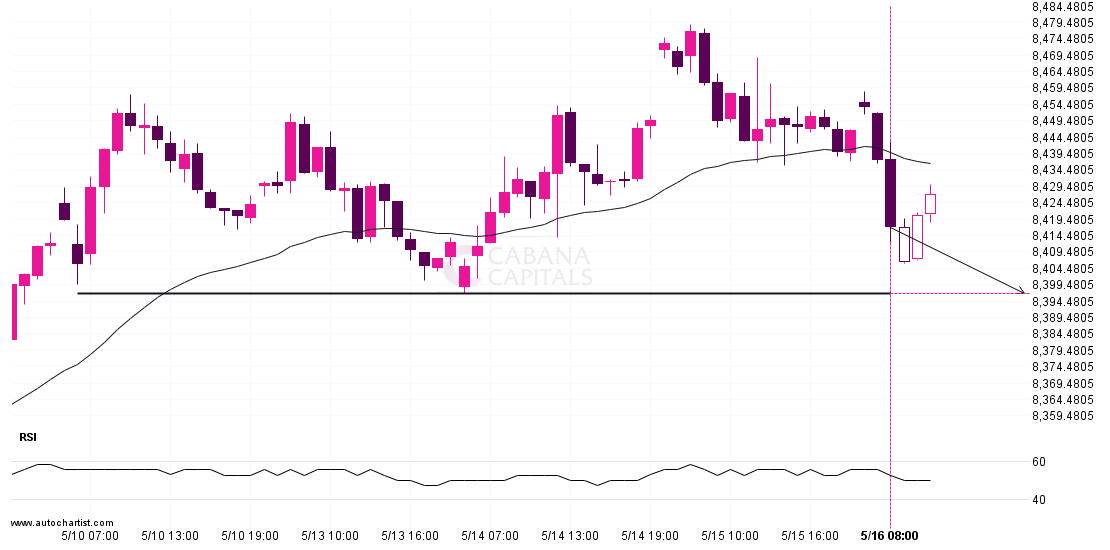
FTSE 100 is about to retest a key horizontal support level near 8396.9004. It has tested this level 3 times in the recent past and could simply bounce off like

The movement of FTSE 100 towards the resistance line of a Rising Wedge is yet another test of the line it reached numerous times in the past. This line test