GBPUSD breakout through resistanceGBPUSD breakout through resistance
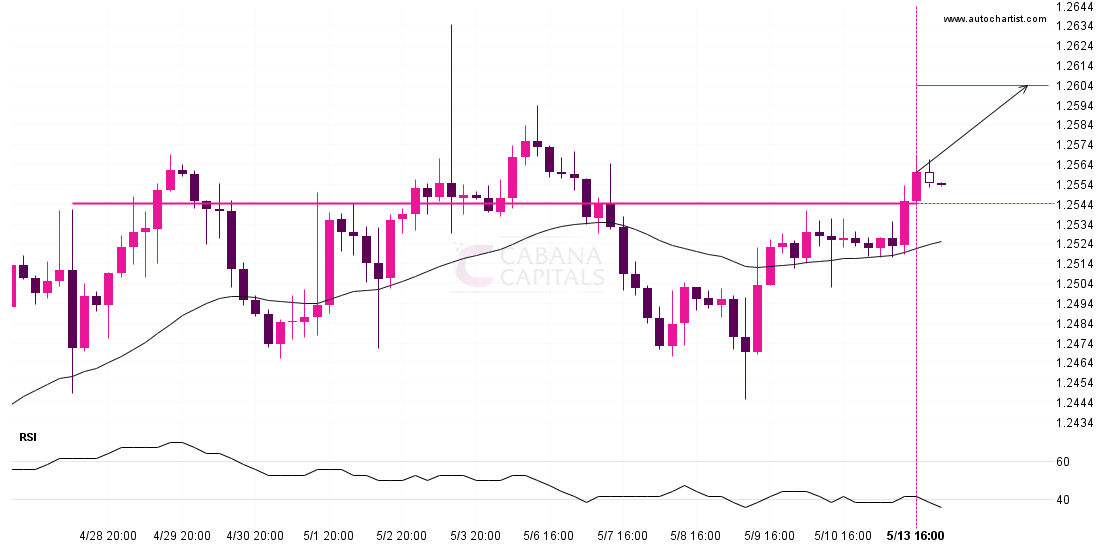
A strong resistance level has been breached at 1.2545 on the 4 hour GBPUSD chart. Technical Analysis theory forecasts a movement to 1.2604 in the next 3 days. Supported by

A strong resistance level has been breached at 1.2545 on the 4 hour GBPUSD chart. Technical Analysis theory forecasts a movement to 1.2604 in the next 3 days. Supported by

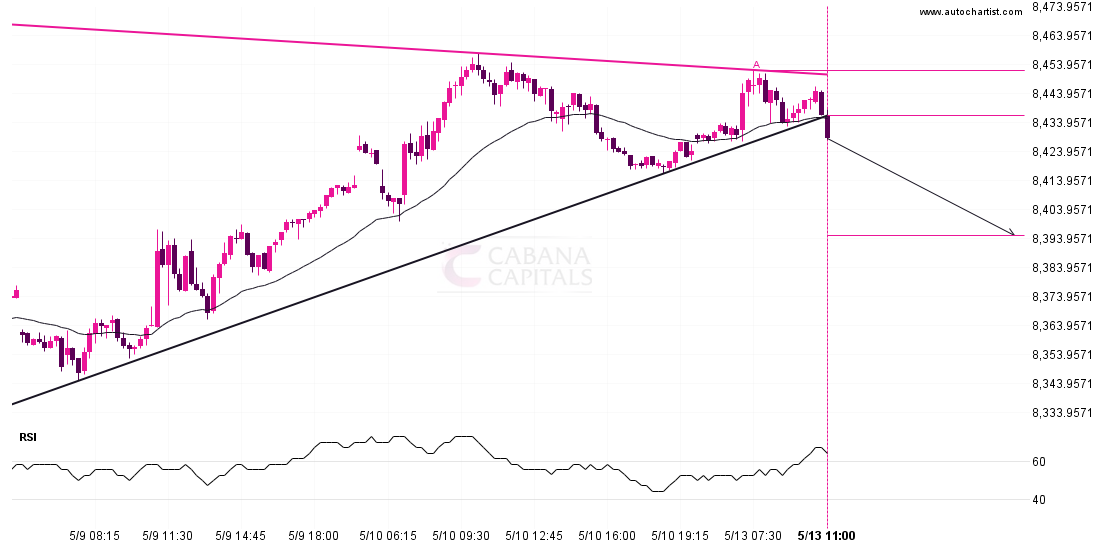
FTSE 100 has broken through a support line of a Triangle and suggests a possible movement to 8394.8587 within the next 11 hours. It has tested this line in the

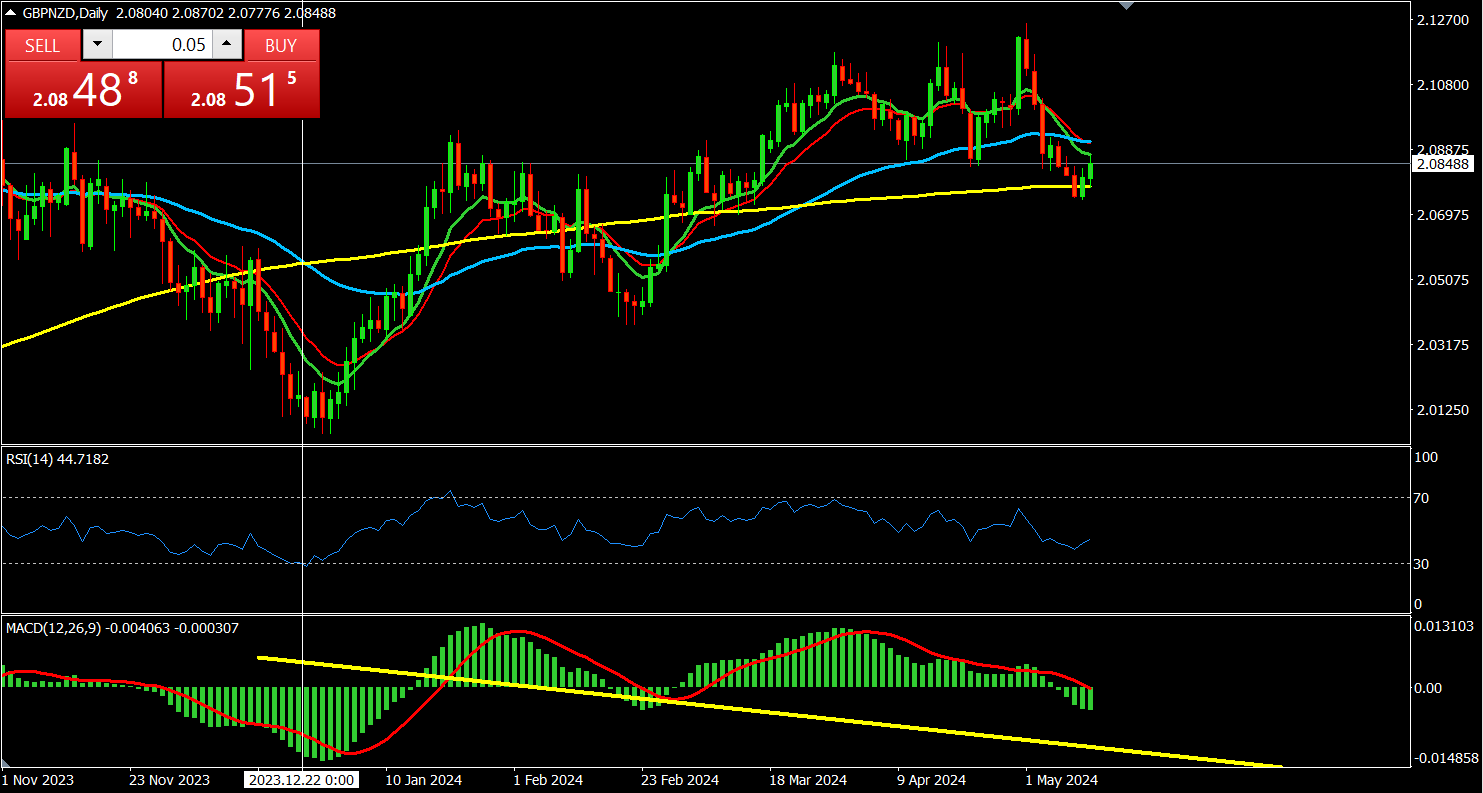
Overview: – By looking at the daily chart we can see that buyers are showing their potential in the market. The market is showing upside momentum in the market. From

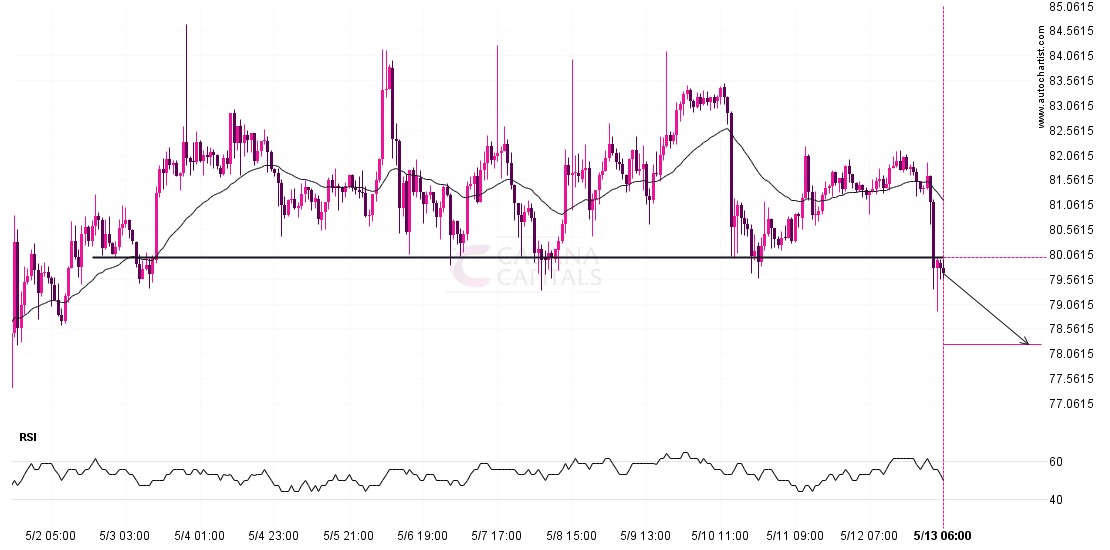
LTCUSD has broken through a support line. Because we have seen it retrace from this price in the past, one should wait for confirmation of the breakout before trading. It