USDJPY breakout through resistanceUSDJPY breakout through resistance
USDJPY is once again retesting a key horizontal resistance level at 151.5850. It has tested this level 3 times in the recent past and could simply bounce off like it
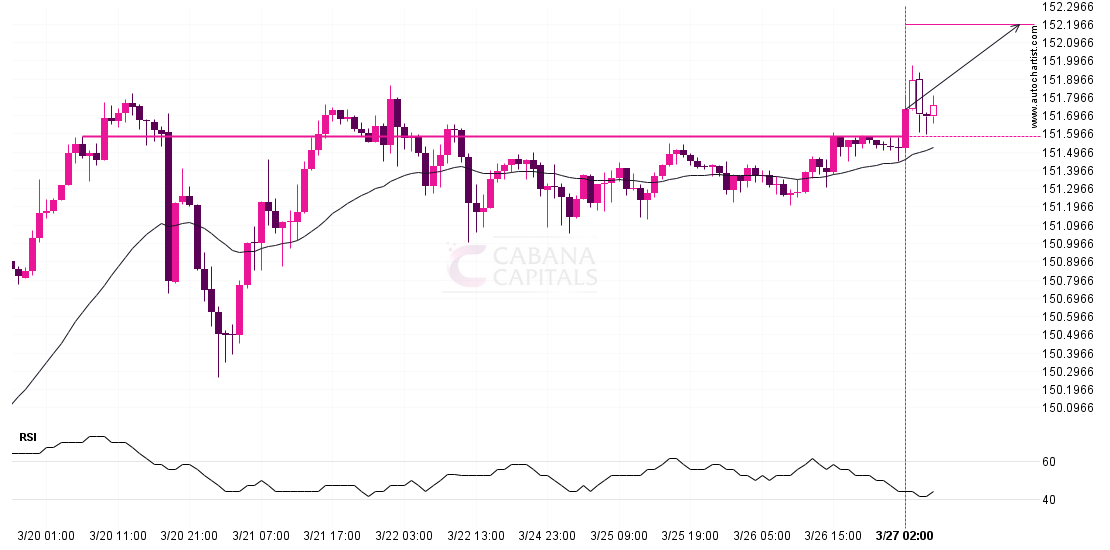
USDJPY is once again retesting a key horizontal resistance level at 151.5850. It has tested this level 3 times in the recent past and could simply bounce off like it
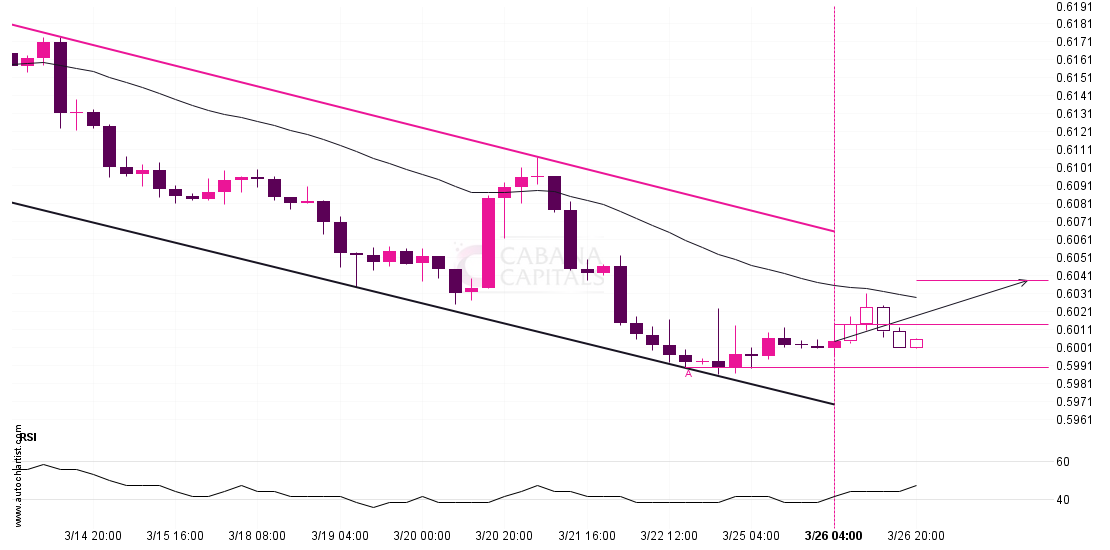
An emerging Channel Down has been detected on NZDUSD on the 4 hour chart. There is a possible move towards 0.6038 next few candles. Once reaching support it may continue
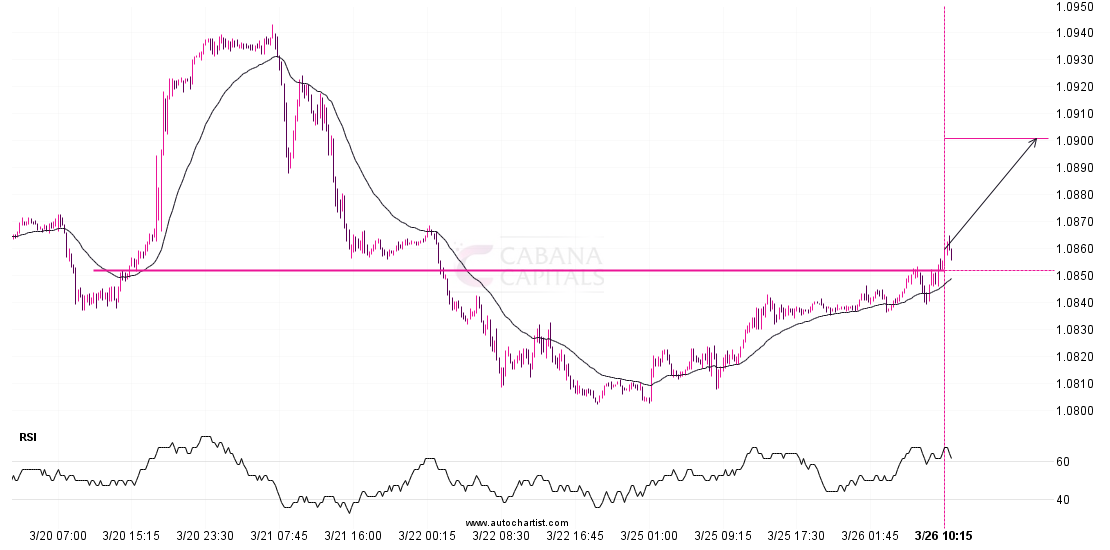
EURUSD is once again retesting a key horizontal resistance level at 1.0851. It has tested this level 6 times in the recent past and could simply bounce off like it

Overview: – By looking at the daily chart we can see that buyers are showing their potential in the market. The market is showing upside momentum in the market. From
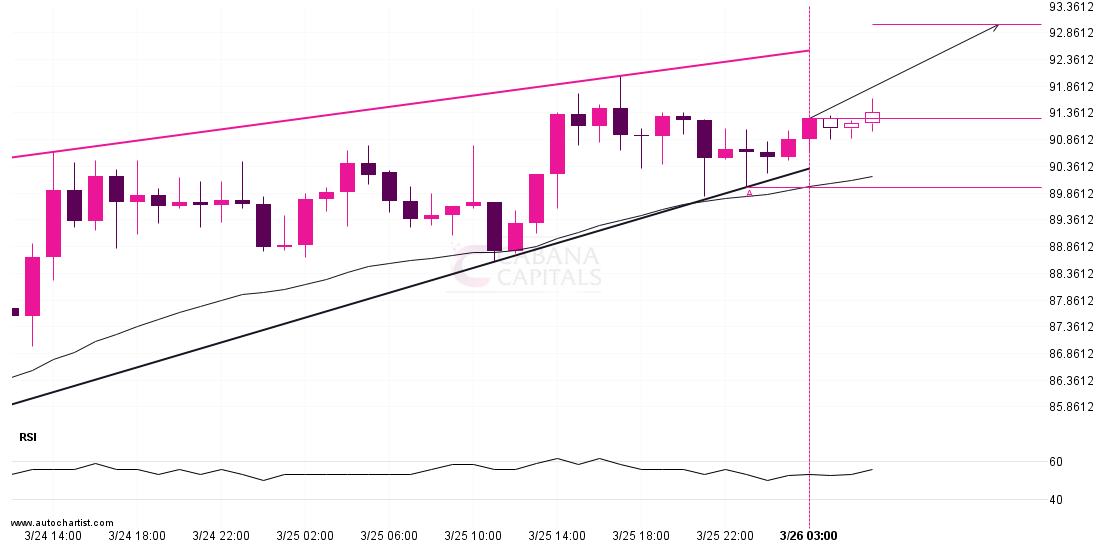
An emerging Rising Wedge has been detected on LTCUSD on the 1 hour chart. There is a possible move towards 93.0067 next few candles. Once reaching support it may continue
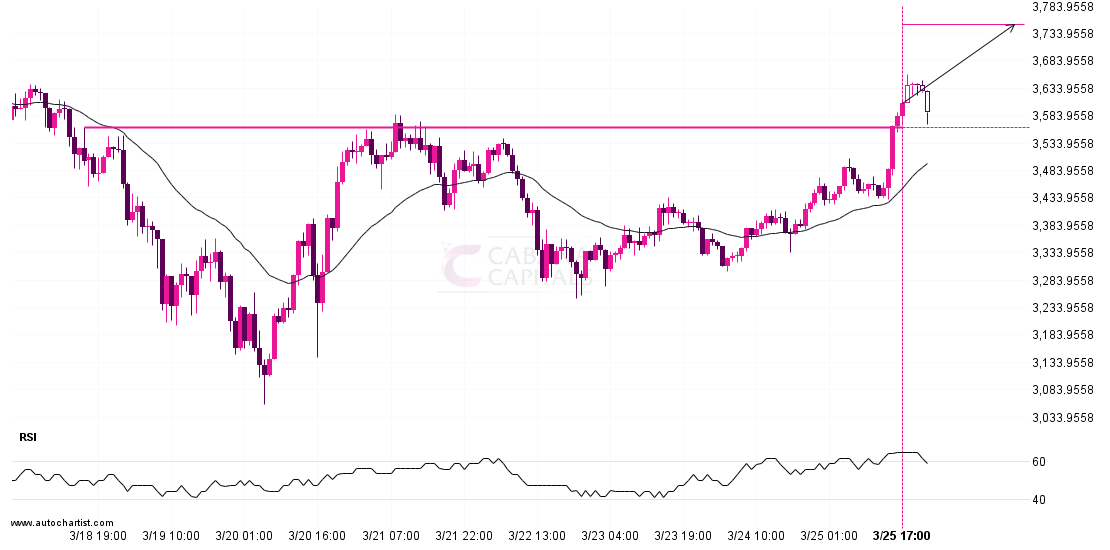
ETHUSD has broken through a line of 3562.0901. If this breakout holds true, we could see the price of ETHUSD heading towards 3749.3850 within the next 2 days. But don’t
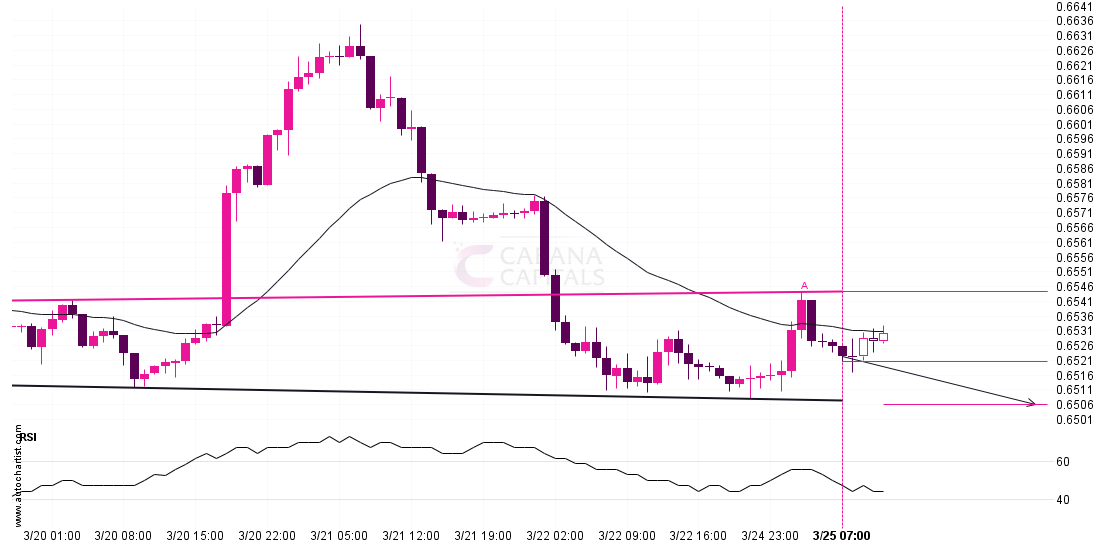
Emerging Head and Shoulders detected on AUDUSD – the pattern is an emerging one and has not yet broken through resistance, but the price is expected to move up over

NAS 100 is en route to a very important line that will be a definite deciding factor of what is to come! We may see this trajectory continue to touch
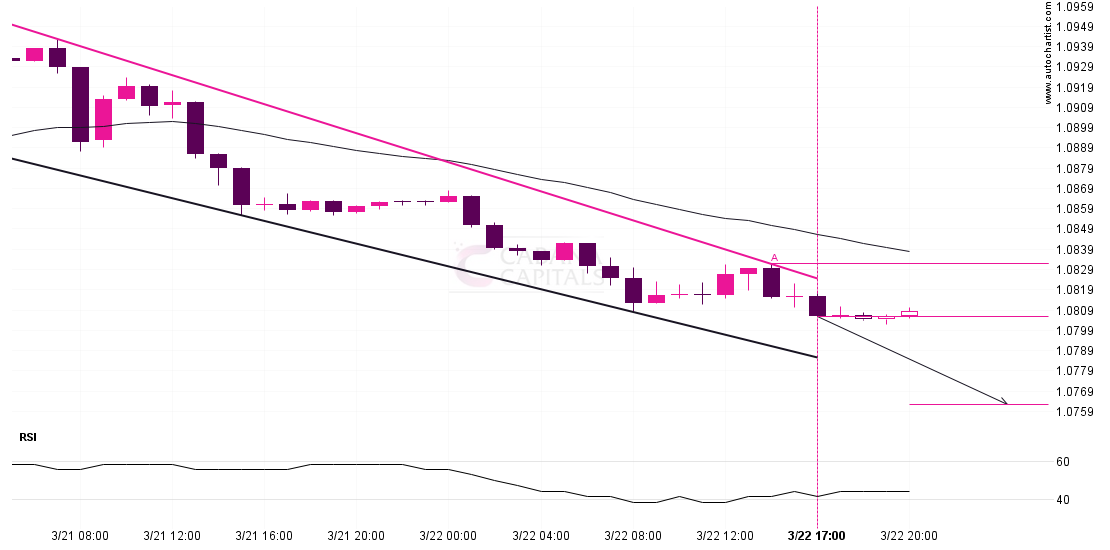
EURUSD is moving towards a support line which it has tested numerous times in the past. We have seen it retrace from this line before, so at this stage it
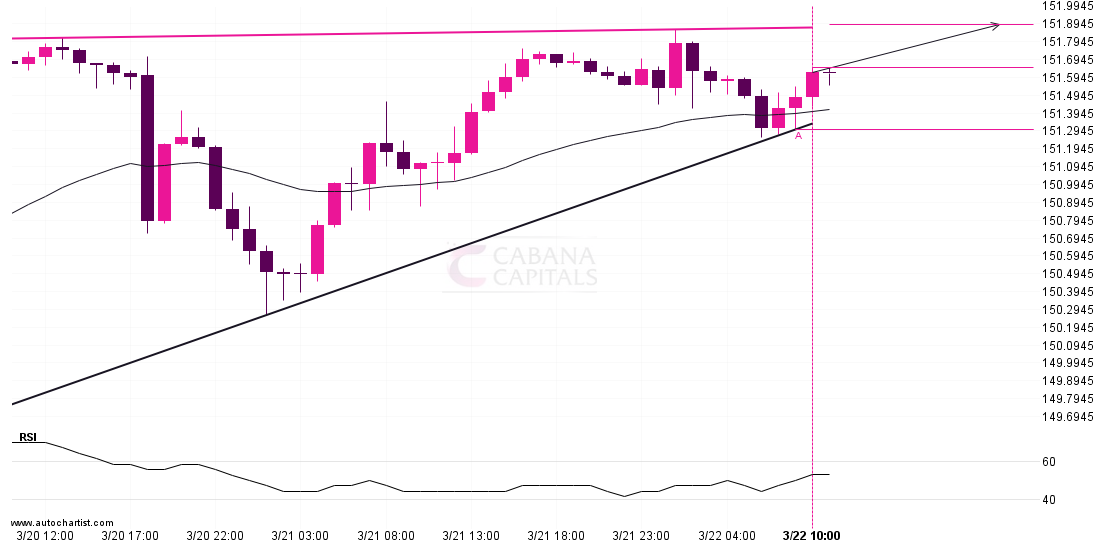
Emerging Ascending Triangle pattern in its final wave was identified on the USDJPY 1 hour chart. After a strong bullish run, we find USDJPY heading towards the upper triangle line