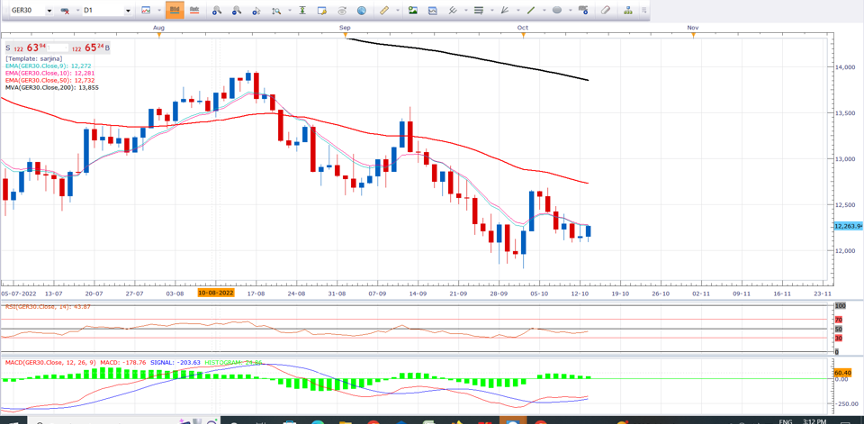
General overview: By looking at the daily chart we can see that buyers are showing their potential in the market. The market is showing upside momentum in the market. From the technical prospective, The market is previously formed three bullish candle which cause market to rise, the swings are making successively lower lows and lower highs, In the chart hourly chart bulls are showing their strong side in the market . The way bulls are reacting it seems like they are approaching the 13000region. The pain will create ‘V’ shape on daily chart.
Technical analysis: From the technical point of view we can say that market makes the bearish side in the market. The pair makes the negative side in the market and creates the potential bullishness in the chart.Deep majority the positive factors, the US30 pair, so breakdown. The pair is below the major and minor EMA and SMA lines and formed the potential buy sign towards the market. Odds are also favors of the bulls in market. On the 4 hourly charts market is break the 12500 level to break to gain more buying momentum in the market. The RSI is also above the 50 level and macd is also below above level in the market. Traders can do buy on dips level 12400.
Trade idea: Our traders will move towards the buy at 12250 target will be 12700,13000 stop loss will be 11800.


