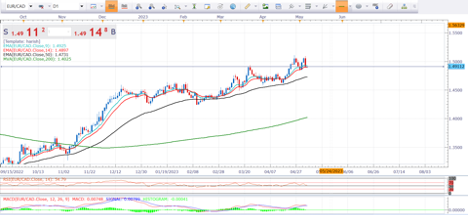
General overview: USD/CAD was seen consolidating the overnight strong gains to the highest level since May 5.Hawkish Fed continued underpinning the USD, albeit retreating US bond yields capped gains. A further pullback in oil prices weighed on the loonie and acted as a tailwind for the major. The pair formed the bullish zone in the chart and stand towards the selling side .The market is forming upward slope as the uptrend trend line formed on daily chart. The pair makes bullish signals in the chart and shows high volatility in the market. USD/CAD stays on the bulls radar. However, a clear break below the recent high of 1.2750 becomes necessary to confirm the bullish chart pattern, namely ‘rounding bottom.
Technical overview: From the technical point of view for that we can say that market is providing bullish signals to traders. On 4 the hourly chart market is creating potential rounding bottom and leads towards the buying side in the market. On the daily chart the market is creating upside uptrend the more rise can be expected. The positional traders can take their trade towards the buy side in the market. The pair is getting support from the 200 SMA and 50 EMA lines for more bullish confirmation in the market. The market bullish level can be reach till 1.2500 levels. The indicator is also moving towards the bullish side in the market as the RSI and MACD is also leads towards the bullish side in the market.
Trade idea: Our traders will sit towards buy side below 1.2750 target will be 1.2840-1.2880 stop loss will be 1.2620.


