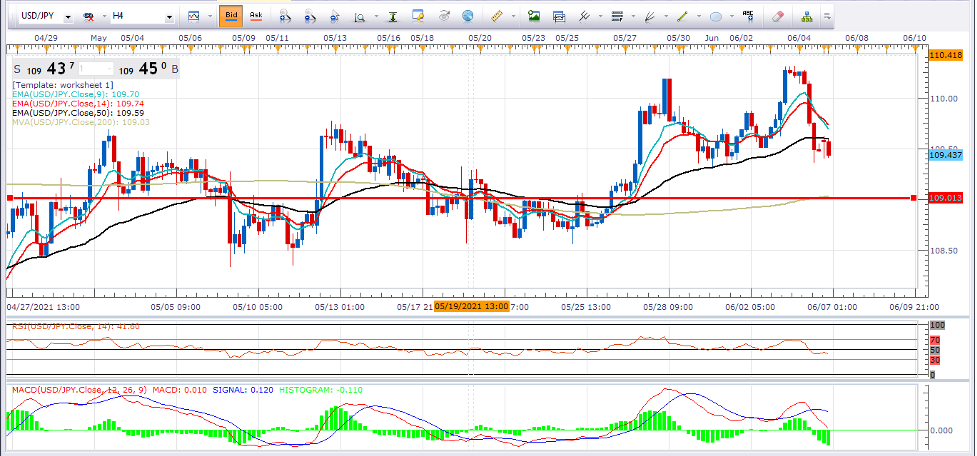
Overview:- From the past couple of days we are witnessing the tug of war between bulls and bears where bulls were trying their best to take it upside whereas bears are trying their best to take the pair at the downside. Well, the way both are fighting it seems like bulls are going to win this battle as momentum is already favoring them and short term to the intermediate-term trend is up so in an uptrend market always buy on dips which will be a profitable strategy.
The aggressive traders may go for buy but for a very near term target of $1960 and $1980 only. Gold is looking strong on the daily along with 4 hourly charts. The way bulls are reacting it seems like they are approaching the $2000 level and we may see further confirmation above the $1950 level.
Technical Analysis: – From technical perspective, we can see a potential rounding bottom pattern is in process of formation which is providing us the bullish signal and above $1950 level bulls will get more aggressive. On 4 hourly chart a symmetric triangle pattern has been formed which is providing us the bullish signal and a breakout on either side will give us new buy or sell signal on a positional basis. The yellow gold is trading and sustaining above all the major and minor EMA lines on the daily chart and providing us a bullish signal for the time being. A bullish crossover on the MACD indicator is still favoring the bulls on daily chart which is pushing us to have a bullish view on the gold. Odds are in favor of bulls and daily to weekly bias remains bullish on gold as long as $1900 level remains intact. The way gold is trading and moving on the daily chart it seems like $2000 and $2050 level is the unfinished target of bears.
What next:- The bulls are dominating the bears leading in the game and playing at the front foot and it seems like bull are going to continue with this game and will dominate the bears in the near term with full of pace and they are approaching the at $2000 level in coming weeks. The $1900 is made or break level can be considered as key support level followed by $1880 where $1980 is a key resistance level followed by $2000 level.
Trade idea:- Based on the chart and study above we would suggest that go for buy at 1930-32 for a target of $1970 and $2000 level with a strict stop loss of $1900 level.
Disclaimer: This is to be considered a marketing communication only, this does not contain, and should not be construed as containing, investment advice or an investment recommendation or investment research or, a record of our trading prices, or an offer of, or solicitation for, a transaction in any financial instruments. Past performance is not a guarantee of or prediction of future performance. Cabana Capitals does not take into account your personal investment objectives or financial situation. Cabana Capitals makes no representation and assumes no liability as to the accuracy or completeness of the information provided, nor any loss arising from any investment based on a recommendation, forecast or other information supplied by an employee of Cabana Capitals, a third party or otherwise. Consequently, any person acting on it does so entirely at their own risk. This material has not been prepared in accordance with legal requirements promoting the independence of investment research and it is not subject to any prohibition on dealing ahead of the dissemination of investment research. All expressions of opinion are subject to change without notice. Any opinions made may be personal to the author and may not reflect the opinions of Cabana Capitals. This communication must not be reproduced or further distributed without prior permission.


