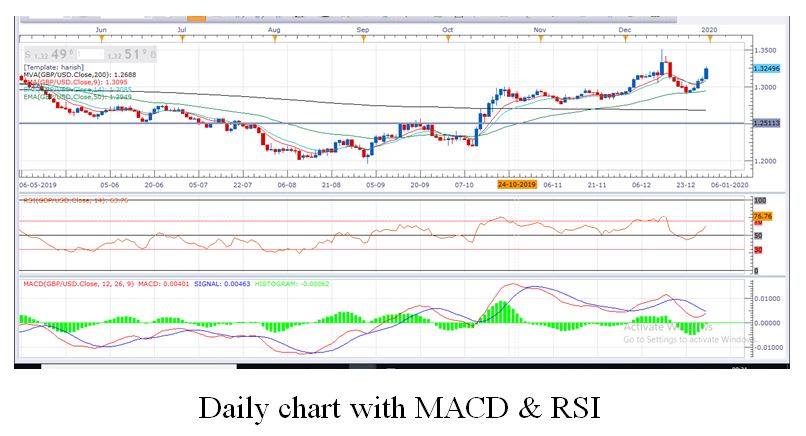
By analyzing the daily technical chart we can see that earlier bears were leading in the game and played at front foot, even they were dominating the bulls at every nook and corner due to which pair slipped continuously from the 75 level to 60 level, without taking any rest. But after arriving at that level we have seen a panic buying or short recovery rally on the same day. After that bulls took the charge and they took the pair to 67 level today at the time of writing.
Also, bulls cleared all the minor EMA lines (9,14) and now it seems like bulls are going up to test the 70 level markup. Which is purely a ‘V’ shape recovery.
Well hourly chart along with daily chart is giving impression like bulls are leading in the game and taking the charge it seems like they are driving the car. If other thing remains constant, it is likely that the Australian Dollar continues to gain against the Japanese Yen during the following trading sessions. The next targets for the pair could be the 70 and 72 level.
The odds are in favor of bulls and intraday bias remains bullish on the pair as long as 65.00 level remains intact on closing basis. A bullish crossover on MACD indicator is the recent development on the chart and favoring the bulls and providing us bullish signal for the time being and RSI is also providing bullish signal as it left oversold territory already. The 70.00 level is immediate resistance level followed by 73.00 whereas 65 level is strong key support level followed by 63 level.
Trade idea:- Based on chart and studies above we would suggest our readers that buy at current levels 67 for the target of 70 and 73 with the tight stop loss of 64.00.


