
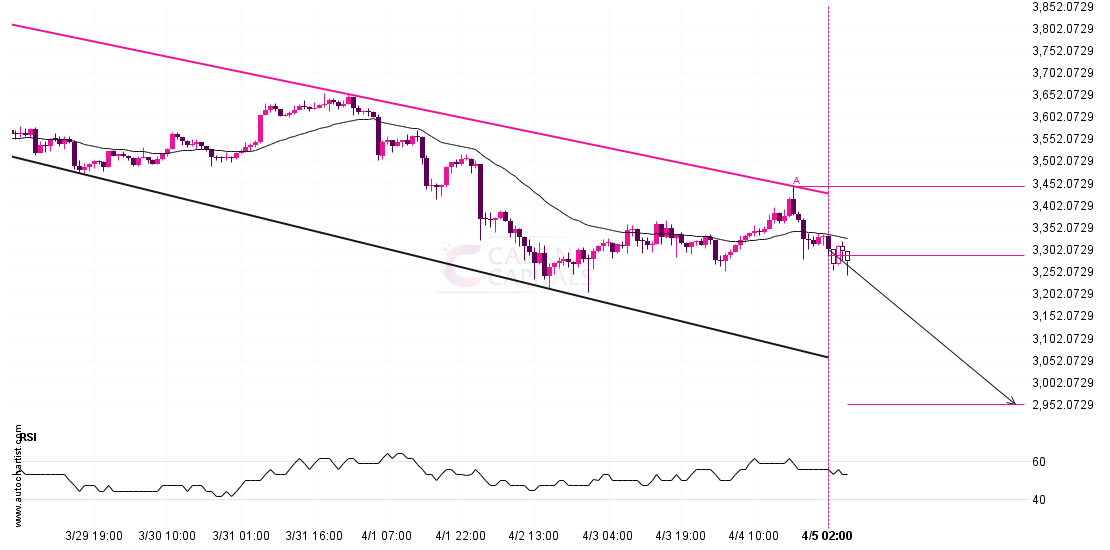
ETHUSD is heading towards the support line of a Channel Down. If this movement continues, the price of ETHUSD could test 2953.1766 within the next 2 days. It has tested

Either a rebound or a breakout imminent on USDCHFEither a rebound or a breakout imminent on USDCHF
A strong support level has been identified at 0.9000 on the 1 hour USDCHF chart. USDCHF is likely to test it soon. Supported by Downward sloping Moving Average Target: 0.9

Support line breached by USDCADSupport line breached by USDCAD
USDCAD moved through the support line of a Triangle at 1.3535681395348838 on the 4 hour chart. This line has been tested a number of times in the past and this

GBPNZD: It’s time to check the potential of bears.GBPNZD: It’s time to check the potential of bears.
Overview: By looking at the daily chart we can see that sellers are showing their potential in the market. The market is showing downside momentum in the market. From the
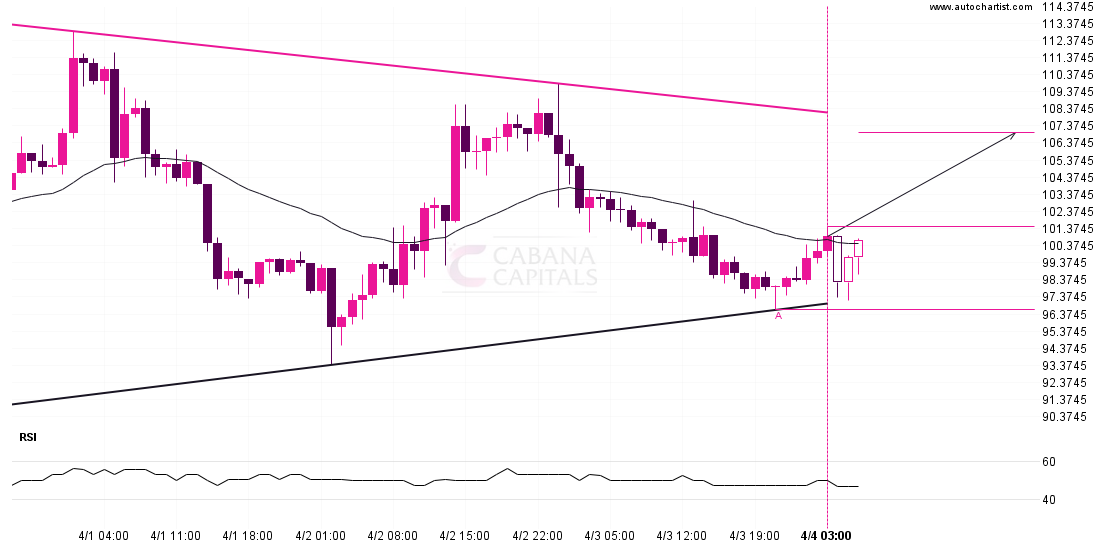
A potential bullish movement on LTCUSDA potential bullish movement on LTCUSD
Emerging Triangle pattern in its final wave was identified on the LTCUSD 1 hour chart. After a strong bullish run, we find LTCUSD heading towards the upper triangle line with
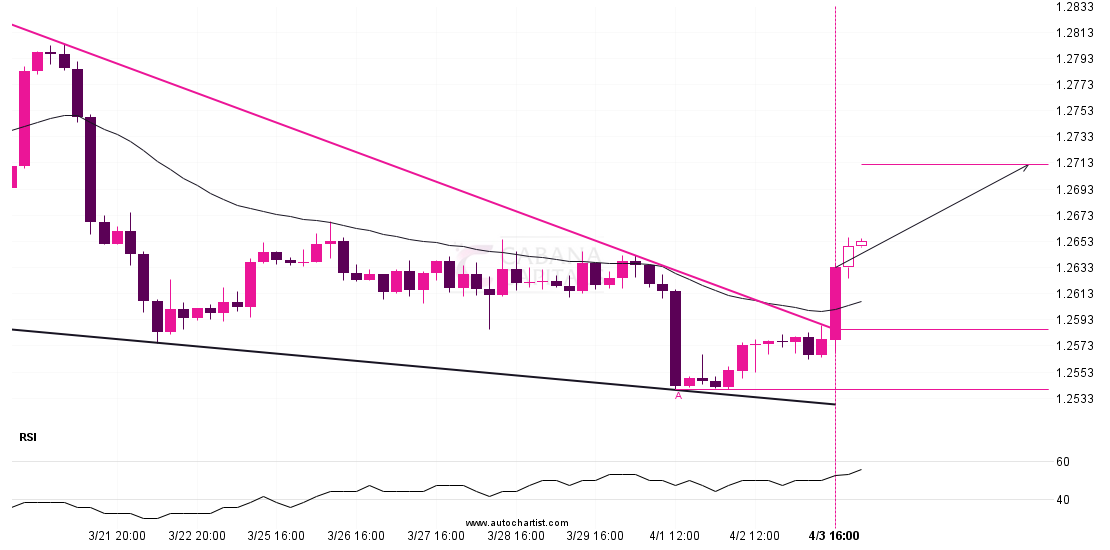
GBPUSD trade outlook at 2024-04-03T14:00:00.000Z until 2024-04-03T14:00:00.000ZGBPUSD trade outlook at 2024-04-03T14:00:00.000Z until 2024-04-03T14:00:00.000Z
GBPUSD has broken through the resistance line which it has tested twice in the past. We have seen it retrace from this line before, so one should wait for confirmation
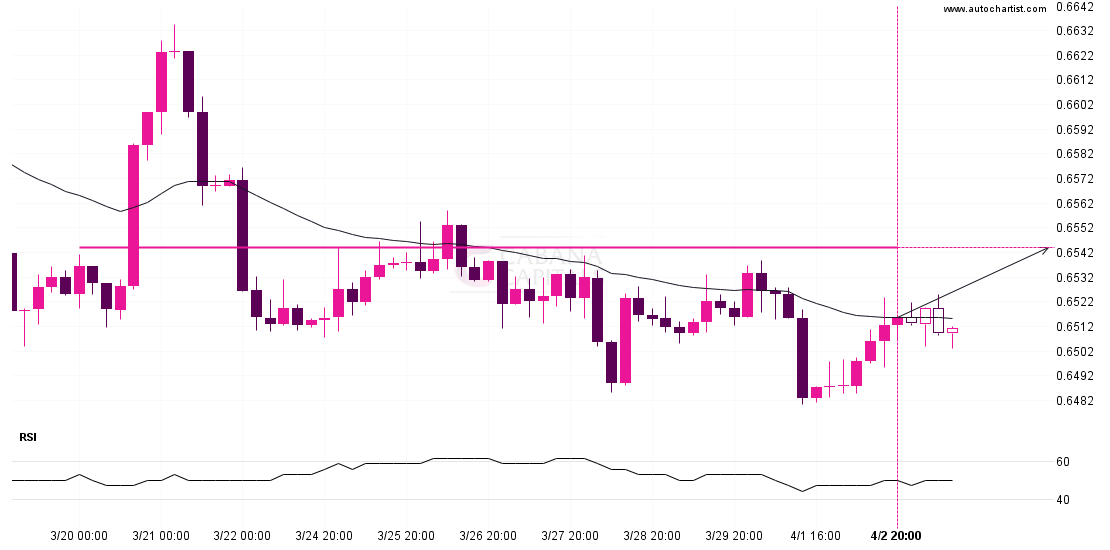
AUDUSD approaching important bullish key levelAUDUSD approaching important bullish key level
AUDUSD is about to retest a key horizontal resistance level near 0.6544. It has tested this level 5 times in the recent past and could simply bounce off like it

GBP/NZD: – Bears have made mind blowing counter attack.GBP/NZD: – Bears have made mind blowing counter attack.
General overview: – By looking at the daily along with hourly chart we can see that the pair hits the lows highs in the market and bears have given us
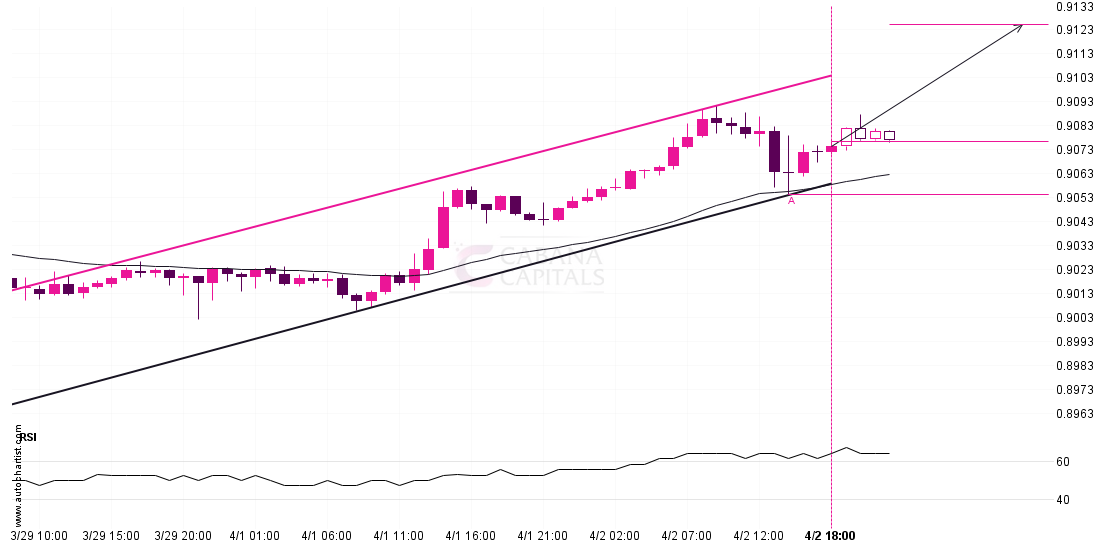
Will USDCHF have enough momentum to break resistance?Will USDCHF have enough momentum to break resistance?
USDCHF was identified at around 0.90761 having recently rebounded of the support on the 1 hour data interval. Ultimately, the price action of the stock has formed a Channel Up

NZDCAD:-Pair has given breakout of key resistance level.NZDCAD:-Pair has given breakout of key resistance level.
Overview:–By looking at the daily chart we can see that buyers are showing their potential in the market. The market is showing upside momentum in the market. From the technical